Consumer Products - Monthly Secondary Sales Performance Report Template
- Consumer Products
- Sales
Industry
Function
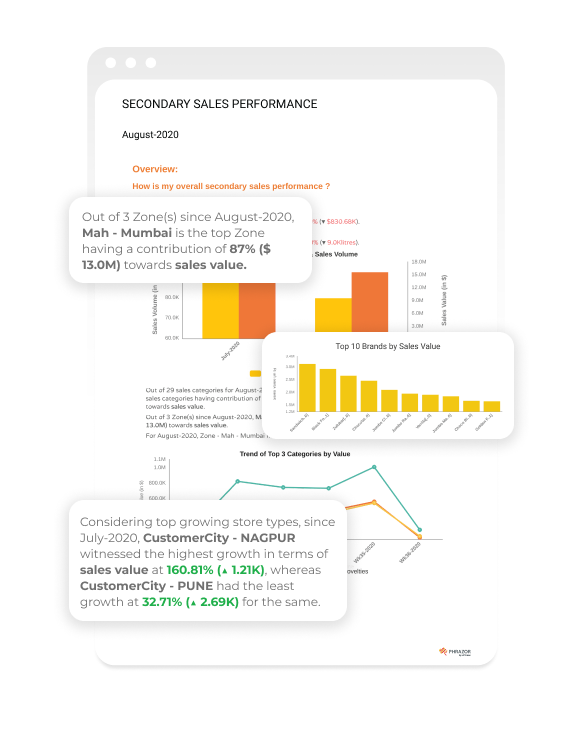
This template will help you analyze the secondary sales performance of your FMCG company and provide detailed insights on the KPIs and numbers. It presents the overall sales movement of a specific brand or SKU, the performance and contribution of them towards secondary sales, along with the individual brand and product performances. It also gives you an overview of the geography-wise secondary sales in the form of visual dashboards and narrative-based smart insights.
The outcome is designed to help the sales team and decision-makers to monitor secondary sales performance and make decisions for salesforce effectiveness.
It answers questions such as:
- How is the overall secondary sales movement of my FMCG company?
- How is the secondary sales performance across products?
- Which geographical zones have witnessed growth or decline, and why?
- Which geographies are most supportive for sales growth?
- Which product categories have the most contribution towards sales?
- Which are my top product categories?
- How well have my brands performed as compared to the top 10 brands?
- Which are the top growing and declining brand/SKU(s) in terms of total sales?
- Which geographies/districts are most supportive towards sales growth?
- Which distribution channels and stores have the highest sales performance?
To use this template, simply download it, connect/upload your data to the dashboard, and run the report, all in just a few clicks.