How to Apply a Global Filter
-
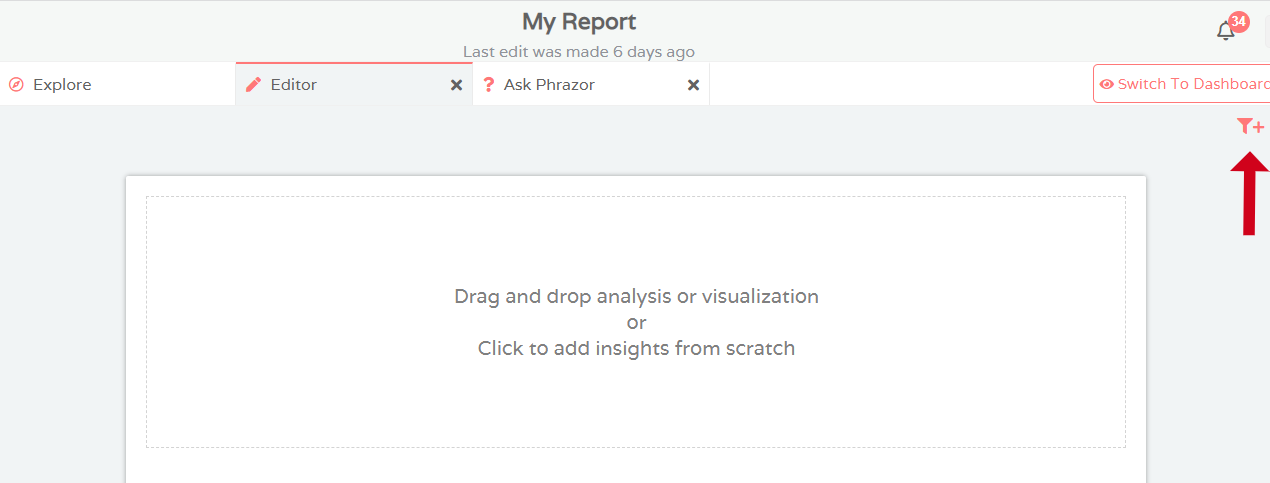
Navigate to the Edit Mode within a project
-
At the top right, click on the available Create Filter icon
-
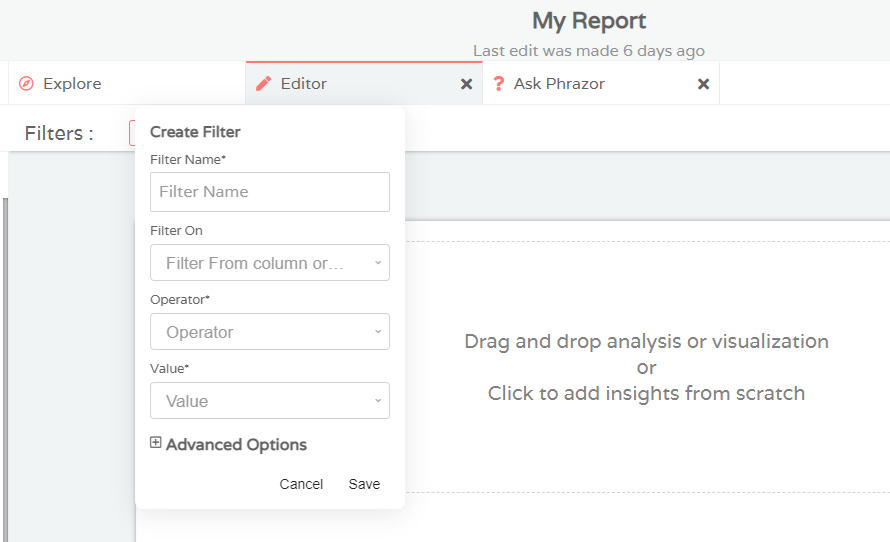
From the horizontal patch at the top, select New

-
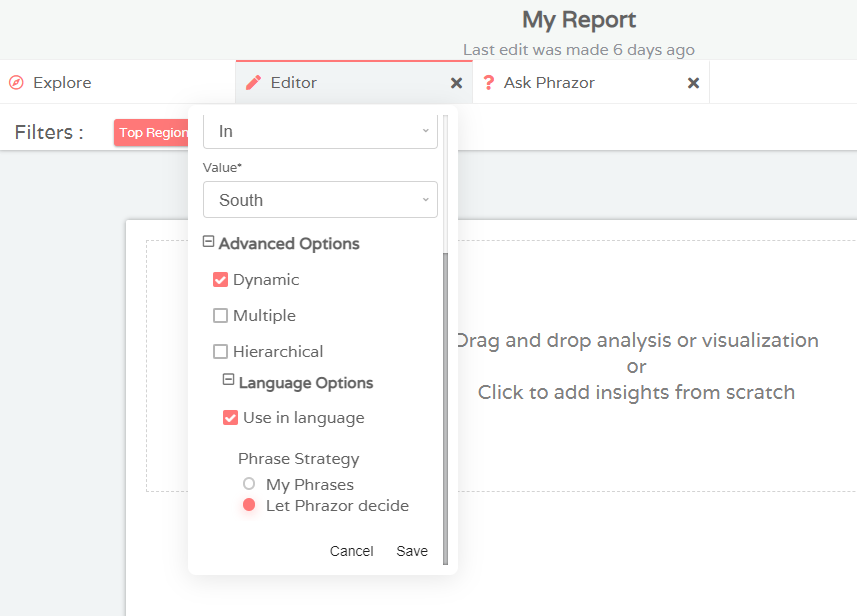
A dialog box will open. Enter the required conditions to create a specific filter
.png)
-
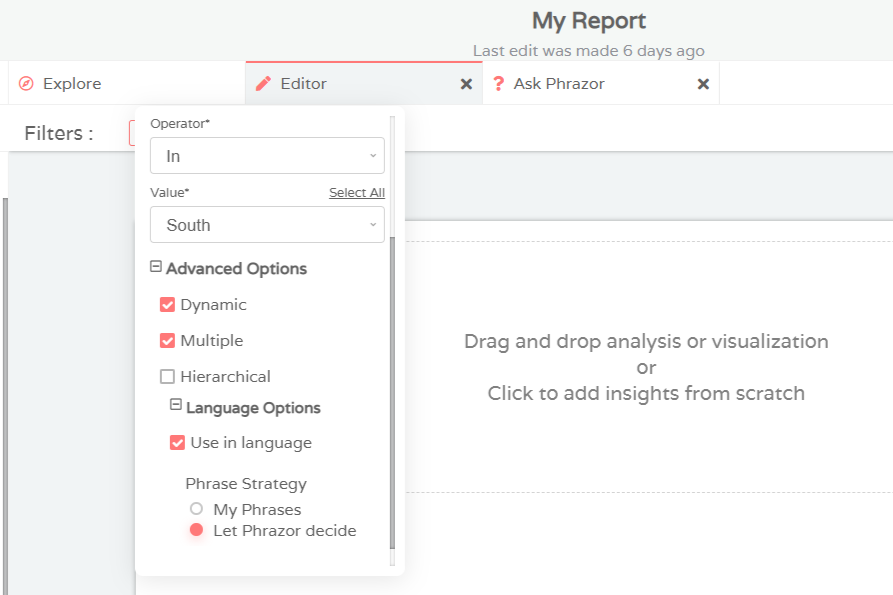
You can also select Dynamic Filters and Language preferences from the Advanced Options as well
-
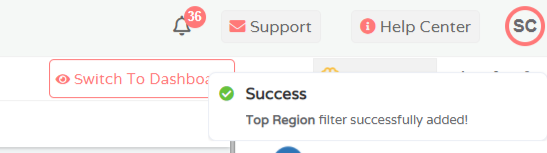
A notification indicating the filter has been successfully added will appear
-
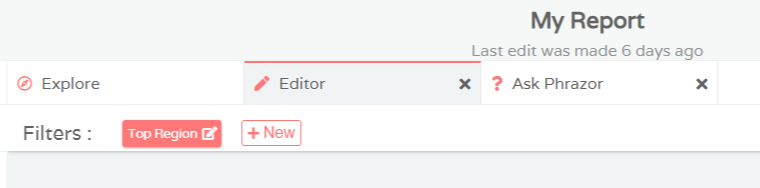
You will also see your newly created filter in the Filters Section at the top
-
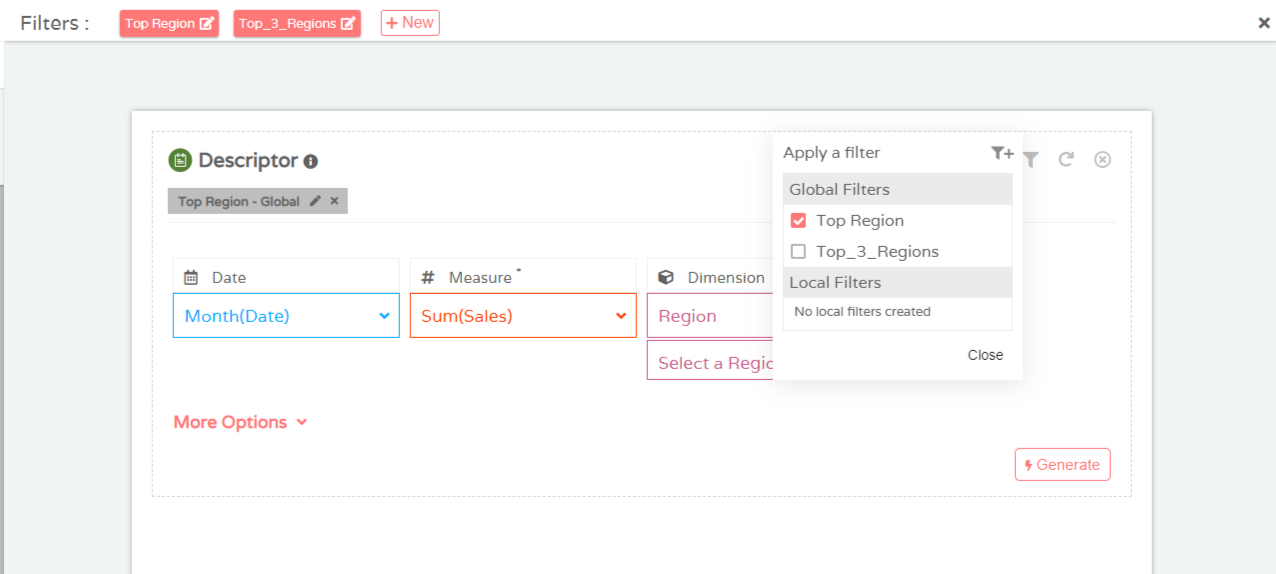
Now within all insight/visualization card, you can directly apply your created global filter by clicking on the additional filter icon that is available
-
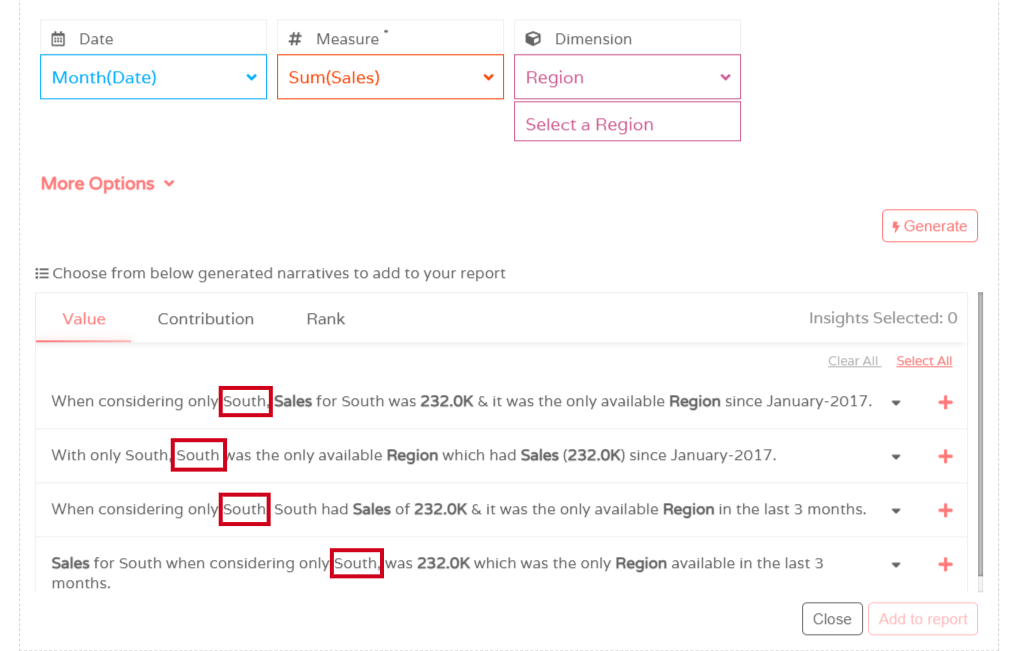
Click Generate. All generated insights will revolve around your applied filter
-
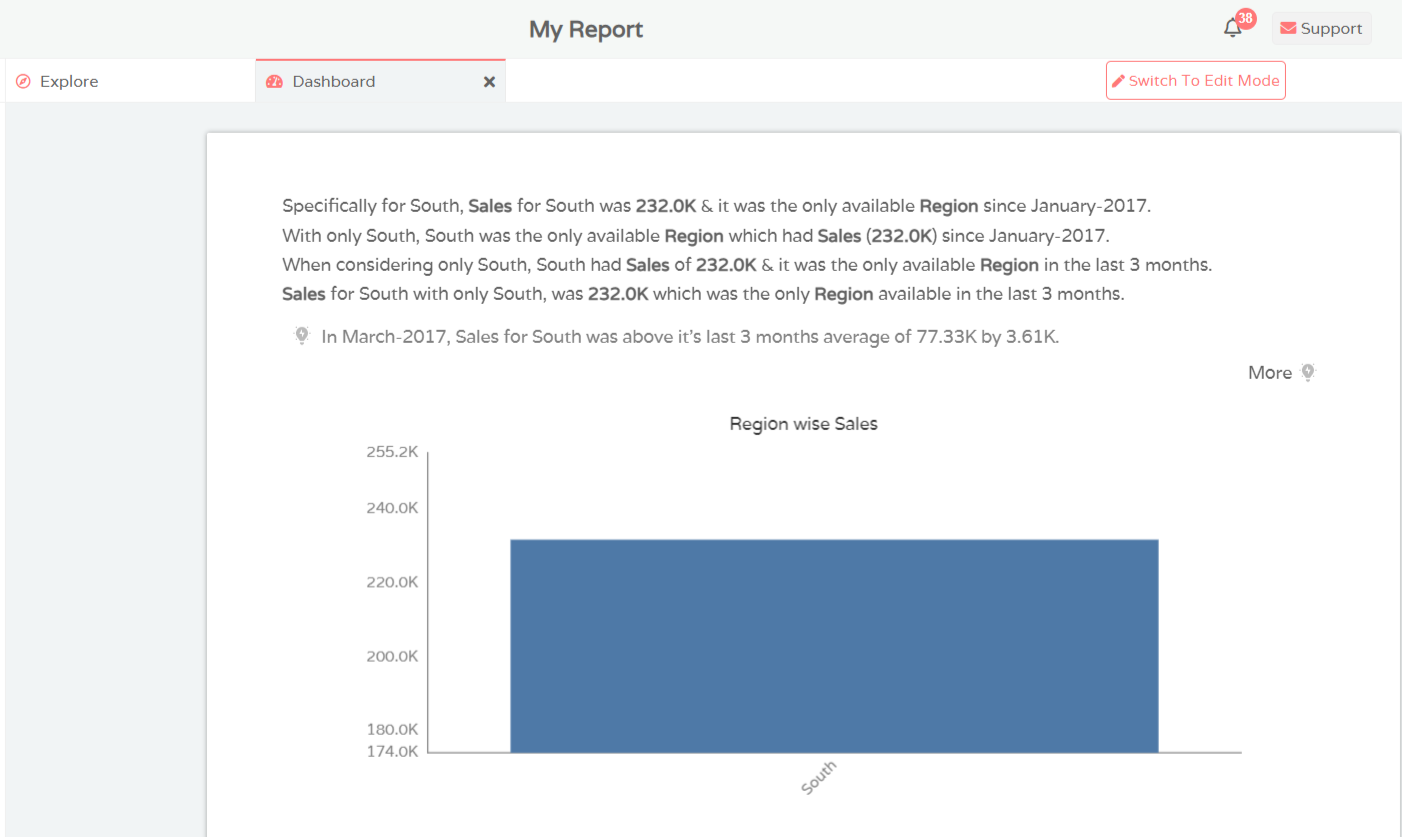
Add required insights to dashboard and switch to Dashboard mode to view final report
How to Create Global Dynamic Dashboard Filter
-
Firstly, create a global filter as directed in the above section
-
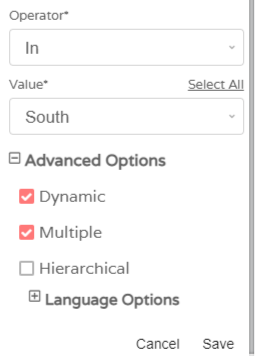
Now, you can include an additional Dynamic option that will make the filter available on the dashboard as a user-selectable filter. Select the accompanying language as per preference as well
-
If you want the user to be able to select multiple inputs for this filter from the dashboard, tick the ‘Multiple’ select option
-
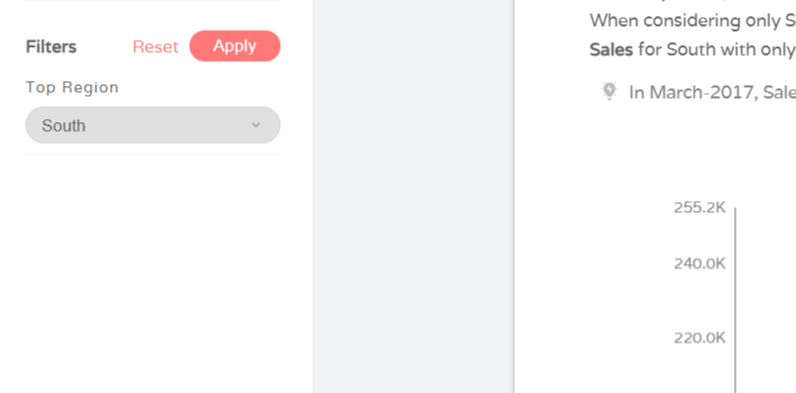
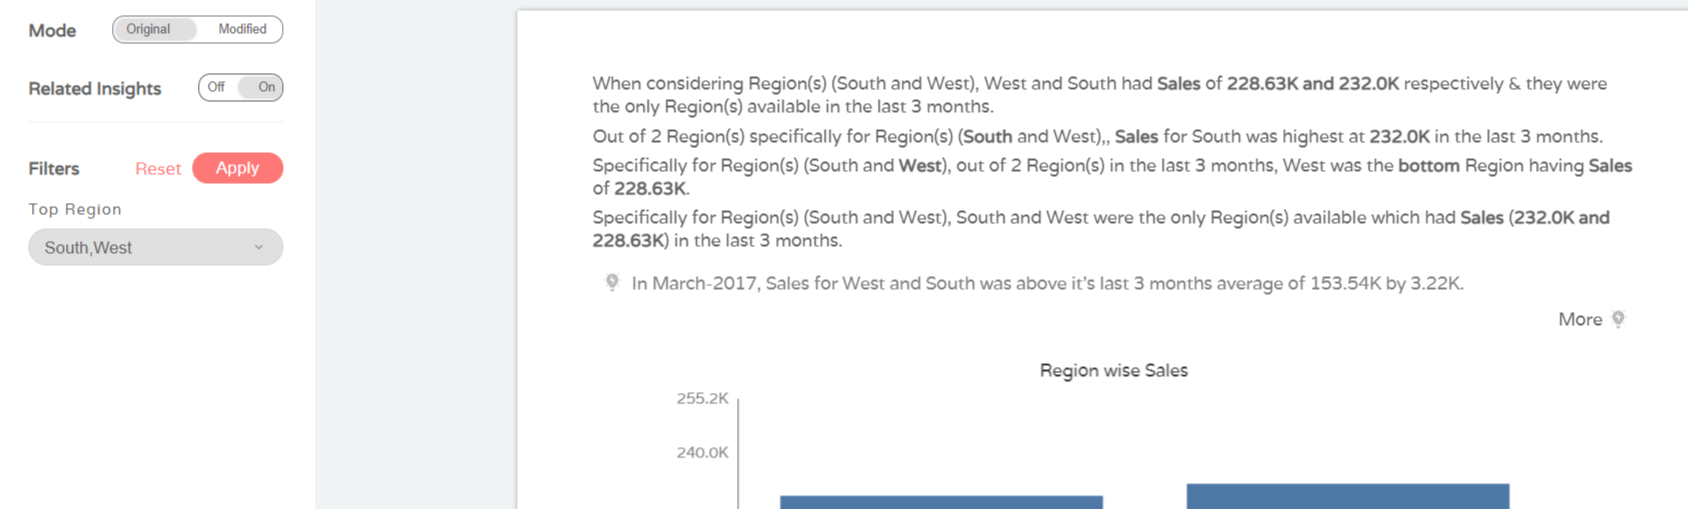
Switch to Dashboard mode and you will see the final report generated for default values of dynamic filters on the left panel where user can select their filter value and generate report
-
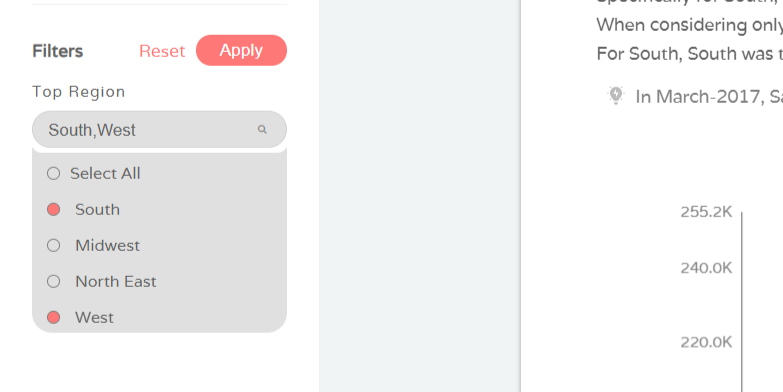
This filter allows for change in the Filter value/s on the Dashboard report. You can select multiple values (South & West) at the same time
-
The report is updated as per the new set of Filters applied
Note: You can apply these filters for visualizations as well as for any type of analyses