BFSI-P&L- Variance vs Budget Report Template
- Financial Services
- Finance
Industry
Function
The income statement of a company helps in recording the revenue, expenses, and costs that are incurred over a specific period. The P&L statement(s) may be maintained by a company at consolidated or Branch levels. This template tracks the variance in revenue and expenses, to arrive at the profit/loss made by the company, and compares it with the budgeted values.
Intended audience: This report is meant for Financial Managers/Analysts.
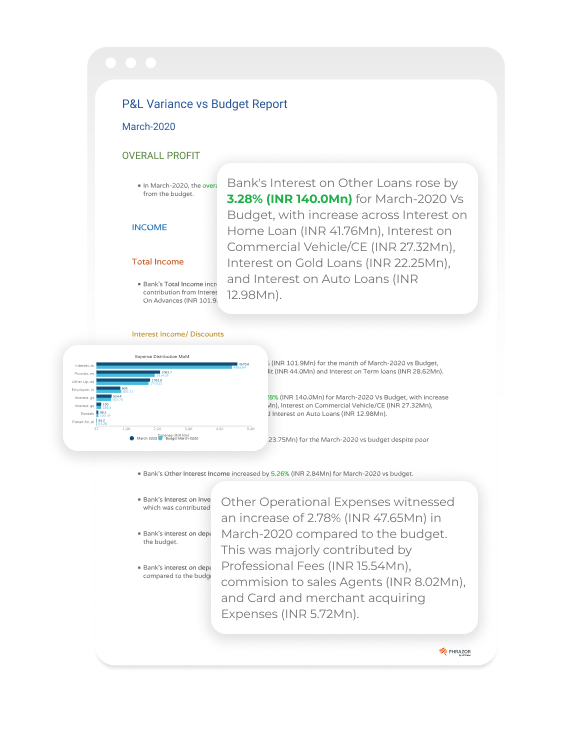
Focus metrics: Related to Interest Income/Discount, Other Income, Interest Expended, Operating Expenses, Provisions and contingencies, Profit/Loss.
When to use: To track the metrics related to revenue and expenses, the user can select any month/year in the drop down and the template will show how the KPIs have changed w.r.t the budgeted value for that period (month or year). The user can also select if the report needs to be generated at a consolidated level or Branch level. The template also provides the drivers of KPIs that have caused variance when compared to the budget values.
To use this template, simply download it, connect/upload your data to the dashboard, and run the report. Start by exploring our auto-generated business analytics and create a report effortlessly in a matter of minutes. The template gives you the flexibility to customize and add comments, analysis, and insights as per your needs if required.