Brand Sales and Distribution Analytics Report Template
- Consumer Products
- Marketing
- Sales
- Strategy
Industry
Function
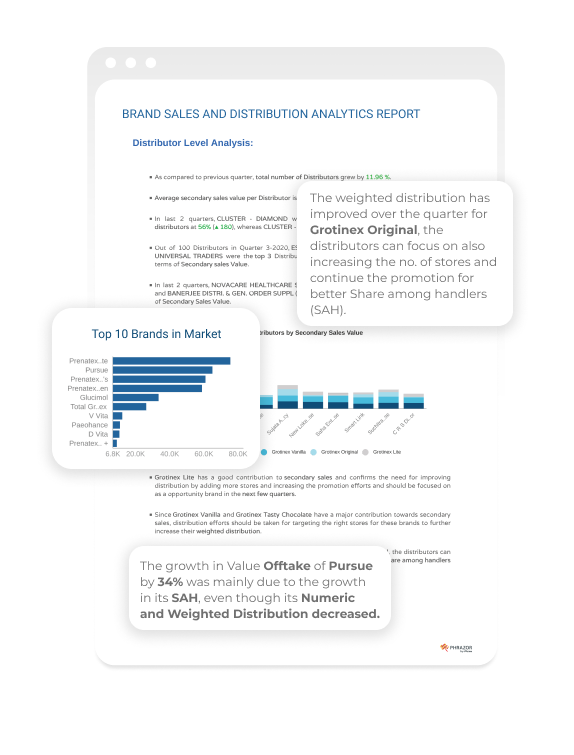
This template provides market intelligence and secondary sales insights to help you analyze the market performance of your brands compared to that of competitor brands using Nielsen market research data. This auto-generated report also gives you inputs related to your brands’ secondary sales distribution and velocity, which helps assess the number of stores in which your brand is available and volumes being sold in each store. The report provides actionable recommendations to improve salesforce effectiveness and brand performance based on distribution numbers.
Intended audience: The Brand Sales and Distribution Analytics report is meant for the Head of Sales, Head of Strategy, Salesforce Effectiveness teams, Regional Heads, and Brand/Category Managers who want to know the market statistics of their brands.
Focus metrics: Offtake Value, Share amongst Handlers (SAH), Numeric Distribution, Weighted Distribution, Secondary Sales Value
When to use: Use this template to know if the right stores are being targeted for sales and if the share of sales in these stores is good. This report template is used to measure the month-on-month growth of your brands, assess brand/category performance, and identify potential business opportunities.
The template supports visual dashboards with relevant analytics written in natural-language summaries to provide data-driven insights for your team.
To use this template, simply download it, connect/upload your data to the dashboard, and run the report. Start by exploring our auto-generated business analytics and create a report effortlessly in a matter of minutes. The template gives you the flexibility to customize and add comments, analysis, and insights as per your needs if required.