P&L - Variance Report Template
- Financial Services
- Pharmaceuticals & Healthcare
- Finance
Industry
Function
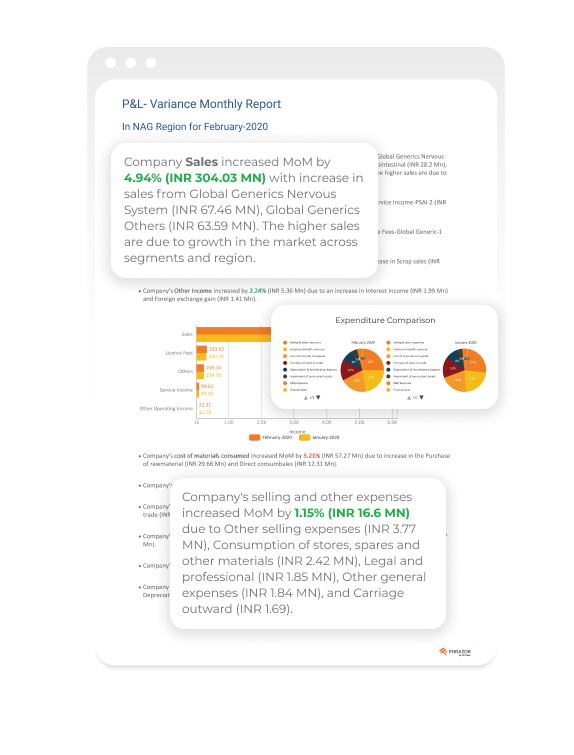
The income statement of a company helps in recording the revenue, expenses and costs that are incurred over a specific period. The P&L statement(s) may be maintained by a company at consolidated or regional levels. This template tracks the movement in revenue and expenses to arrive at the profit/loss made by the company.
Intended audience: This report is meant for Financial Managers/Analysts.
Focus metrics: Related to Revenue from operations, other sources of income, cost of materials, expenses under various cost headers, PAT.
When to use: To track the metrics related to revenue and expenses, the user can select any month/year in the drop down and the template will show how the KPIs have changed w.r.t the previous month/year. The user can also select if the report needs to be generated at a consolidated level or regional level. In addition to this, the template provides the drivers of KPIs that have increased/decreased.
To use this template, simply download it, connect/upload your data to the dashboard, and run the report. Start by exploring our auto-generated business analytics and create a report effortlessly in a matter of minutes. The template gives you the flexibility to customize and add comments, analysis, and insights as per your needs if required.