Consumer Products - Monthly Primary Sales Performance Report Template
- Consumer Products
- Sales
Industry
Function
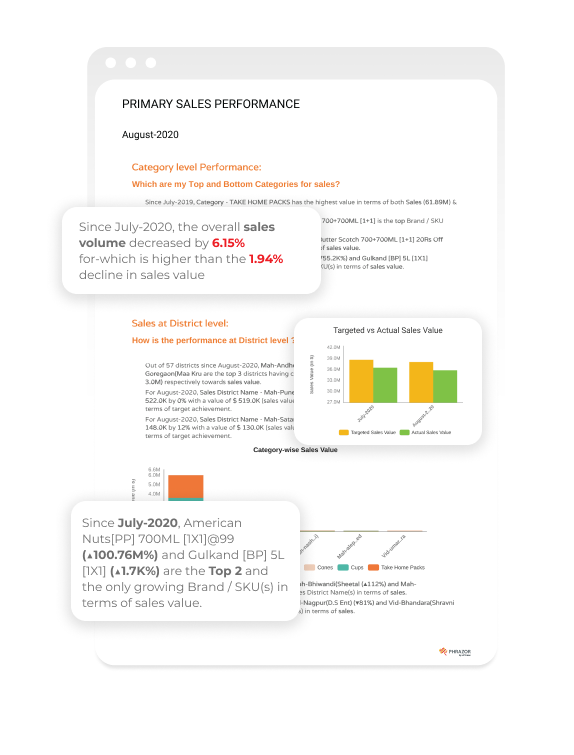
This template will provide a quick snapshot of the current status of your FMCG company’s Primary Sales, by analyzing the data uploaded and auto-generating smart insights. It presents the overall sales value trend for a specific brand or product category, along with geography-wise performance and target achievement trends in the form of visual dashboards and written summaries in natural language.
The end report is designed to support salespeople and decision-makers in taking actionable steps to strategically guide their sales efforts, based on the qualitative and quantitative insights generated.
It answers questions such as:
- How is the overall primary sales movement of my FMCG company?
- How is the primary sales performance across products?
- How much volume is getting sold as compared to the targeted sales value?
- Which are my top and bottom product categories for sales?
- Which brand/SKU(s) have the most sales?
- Which are the top growing and declining brand/SKU(s) in terms of total sales?
- Which geographies/districts are most supportive towards sales growth?
- Which distribution cities and distributors have the most contribution towards sales?
To use this template, simply download it, connect/upload your data to the dashboard, and run the report, all in just a few clicks.