Pharma – Monthly Sales Performance for a Region or Geography Report Template
- Pharmaceuticals & Healthcare
- Marketing
- Sales
- Strategy
Industry
Function
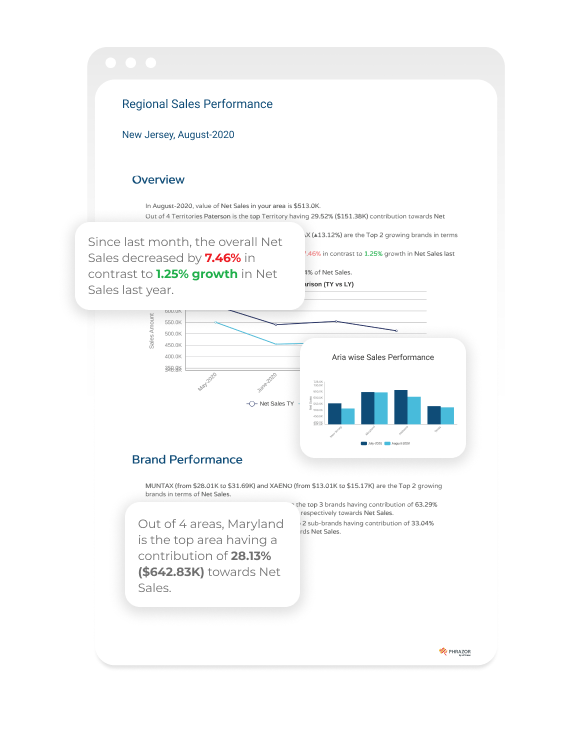
This template will provide the overall regional sales performance of your company by auto-generating smart insights from the input sales data. It highlights the top brands, SKUs and geographies that contributed the most towards the sales growth or decline, in the form of visual dashboards and detailed narratives.
The outcome is designed to support salespeople and decision-makers in taking actionable steps to strategically guide their sales efforts towards efficiently meeting the set goals.
It answers questions such as:
- How is the overall regional sales movement of my pharma company?
- Which are the top contributing brands for sales?
- Which brands have the most and least performance?
- Which SKUs have the most and least performance?
- Which other geographies and territories have the most and least contribution towards overall sales?
To use this template, simply download it, connect/upload your data to the dashboard, and run the report, all in just a few clicks.