Pharma - Integrated Brand Performance Report Template
- Pharmaceuticals & Healthcare
- Marketing
- Sales
- Strategy
Industry
Function
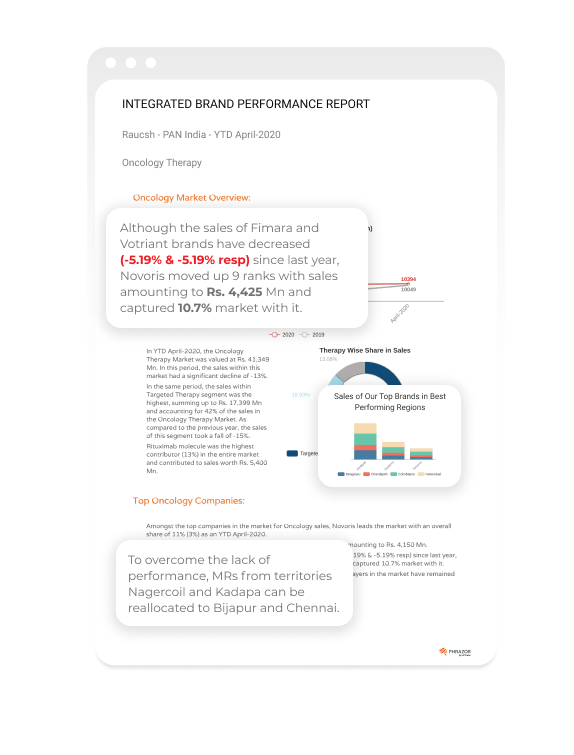
This template can be used by Pharma companies to generate detailed analysis on a specific Therapy’s market performance and within it a specific Brand’s performance or portfolio of Brands’ performance against competitors. It further drills down using internal sales data giving insights on region-wise sales trends for the Brand(s) and a detailed report on the field sales’ (Medical Representatives) coverage and their contribution to brand sales. Finally, it provides prescriptive insights to course-correct to improve overall performance for the existing brand portfolio and salesforce.
The Phrazor report provides an overview of the total market sales, highlighting the therapy segment with the maximum sales, followed by the highest-contributing molecule in the market. It gives inputs on the overall market standing of the top companies, best-performing brands, and how the company and its brands have performed (i.e. ranking and sales amount) vis-à-vis the competition in the same period. It also highlights if any new company or brand has entered the market during that period. Additional sections within the report provide diagnostic insights on the company’s growth and degrowth in the best-performing regions, scope for improvement based on top-performing brands, and their contribution to overall sales. The auto-generated report also takes a close look at the SalesForce Performance based on operations conducted by Medical Representatives (MR) and provides prescriptive insights on the next steps.
Intended audience: The Integrated Brand Performance Report is meant for use by the Brand Manager, Therapy Division Head, Sales Head, Marketing Head, and Regional Sales Managers
Focus metrics: Brand Sales Performance, Medical Representative Performance, Brand Ranking
When to use: This report template can be used by heads of various divisions, namely - Therapy, Marketing, Sales and Strategy when looking to measure market performance, investigate brand sales, and make strategic decisions to drive growth.
The template supports visual dashboards with relevant analytics written in natural-language summaries to provide data-driven insights for your team.
To use this template, simply download it, connect/upload your data to the dashboard, and run the report. Start by exploring our auto-generated business analytics and create a report effortlessly in a matter of minutes. The template gives you the flexibility to customize and add comments, analysis, and insights as per your needs if required.