Onboarding
Question 1:
I have chosen the columns that contain dates, but the Phrazor plugin is still requesting me to select a date column.
Answer:
-
Please ensure if Power BI has accurately detected the date column you selected for your data.
-
Make sure that in the column section of Power BI, the date column is not marked as a Date Hierarchy. If yes, change it to Date.
.gif)
-
If you do not see these options, it indicates that Power BI may not have recognized your date column as a valid date type.
-
You can refer to the microsoft community page on how to change the metric for your column from your data to date.
====================================================================================================
Question 2:
What actions can be taken if the insight generation is taking time?
Answer:
Slow insight generation is typically caused by the following factors:
-
Including unnecessary columns: Consider removing any columns that are not essential for generating insights.
-
High cardinality dimensions: If certain columns have a large number of distinct values, it may be beneficial to remove them to improve performance.
Tip - You can always add multiple instances of plugins, such as adding two bar charts to a dashboard, where you can selectively choose the relevant data for each plugin instance.
====================================================================================================
Question 3:
How to get an in-depth reasoning for your insights?
Answer:
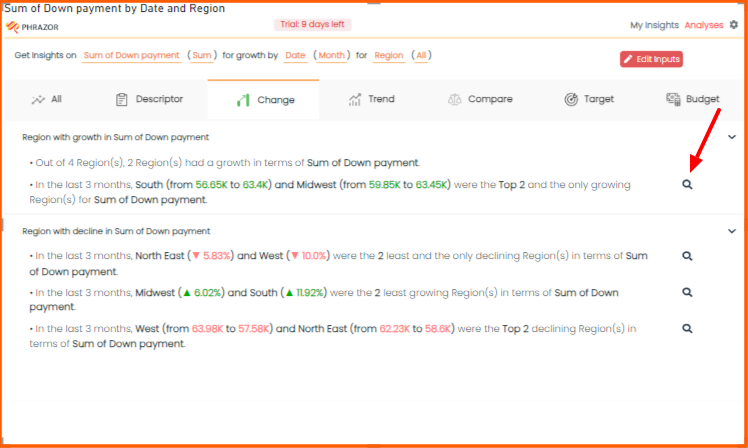
To get an in-depth reasoning for your generated insight, let's take an example with the variation “Change”
- Navigate to the "Change" tab and click on the lens 🔍 icon labeled as "explains the change."

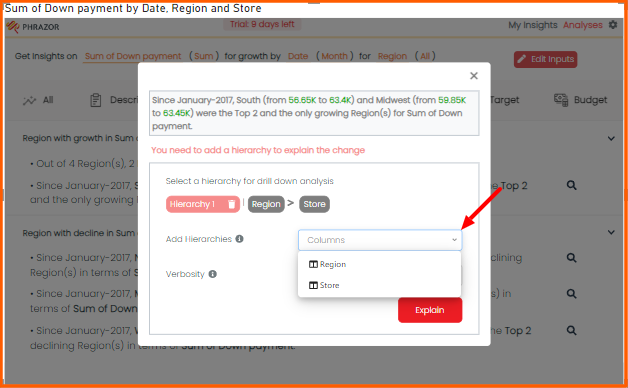
- To get the reasoning behind your insight, you will need to select the hierarchy for your reasoning explanation. (Think of it as a drill down from top to bottom)

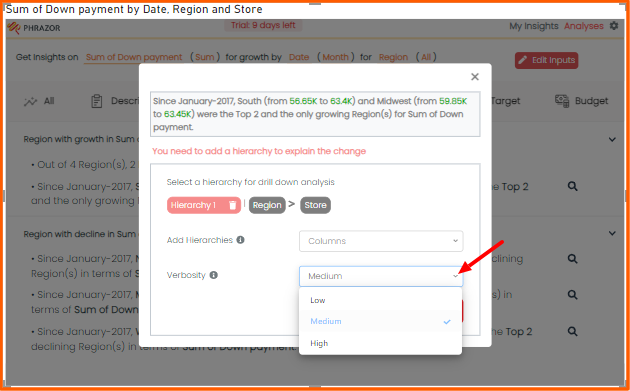
- Select the verbosity from Low to High, to control the depth and number of drivers for your analysis.

- After selecting the Hierarchies and verbosity, Click on Explain.
====================================================================================================
Question 4:
How to make the plugin interactive with my dashboard.
Answer:
Please refer to the steps given below on how to dynamically change your insights as per your dashboard.
The plugin is interactive with other visuals. If you apply a filter on your dashboard that filter will be applied to the plugin as well which will change the narratives dynamically according to the filter applied.
Note: Make sure that the metrics and dimensions which are filtered on your dashboard are used in your narrative insights in Phrazor for Power BI plugin.
Steps:
- Generate insights based on the variation of your choice “Descriptor, Change, Trend, Compare, Target and Budget.
- Pin your insights to your dashboard
- Go to the “My Insights” Tab.
- Click on any visuals outside of the plugin and your pinned insights would get refreshed as per the visual.