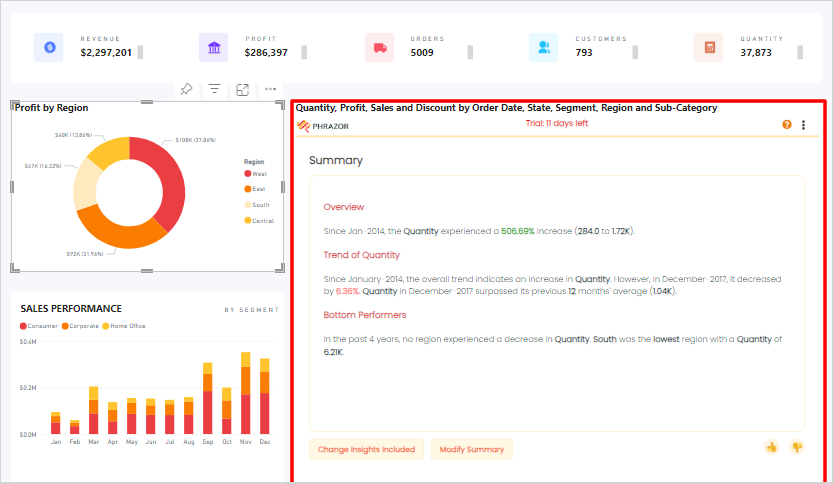
Generate Summary
To generate summaries for various analysis types based on your chosen metrics and dimensions, refer to the steps given below:
- To generate summaries for your Power BI Dashboard, click on the 'Change Insights Included' button.
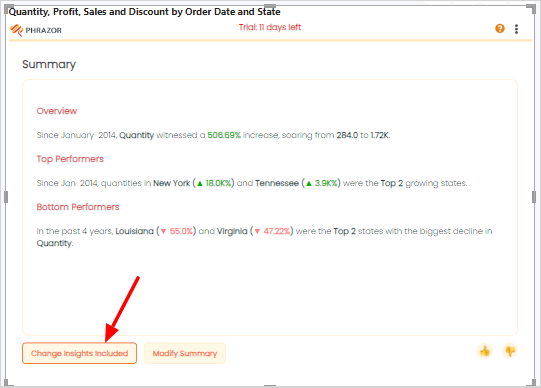
- From the Data panel located on the rightmost side of the screen, choose at least one measure and date to generate a summary of your Insights.
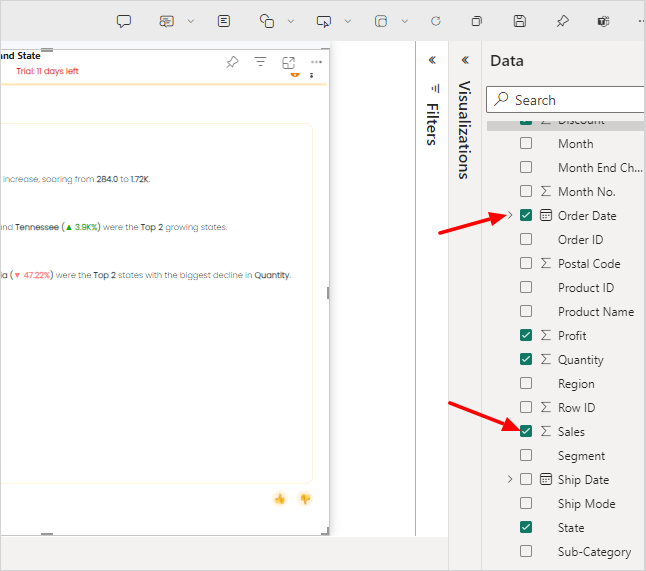
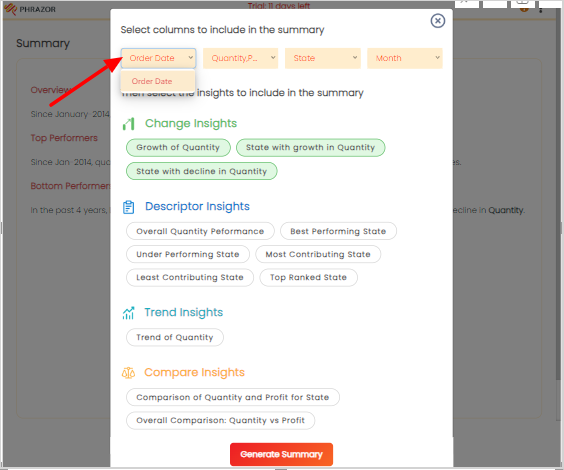
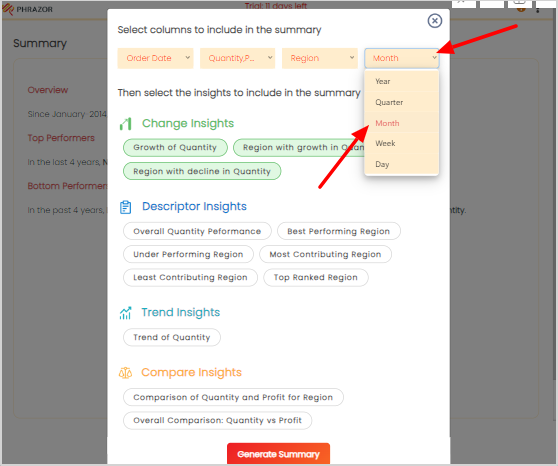
- In case your data contains several columns with dates and you wish to choose a different date, simply click on the first tab and select the date column for which you intend to generate summary.
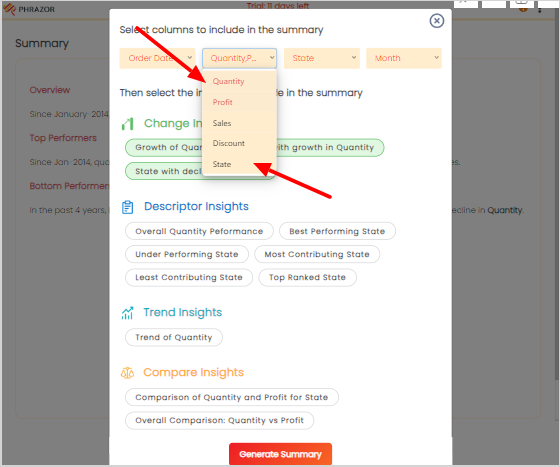
- To change the measures, click on the second tab and deselect the measures which you wish to remove and select the ones which you want to add.
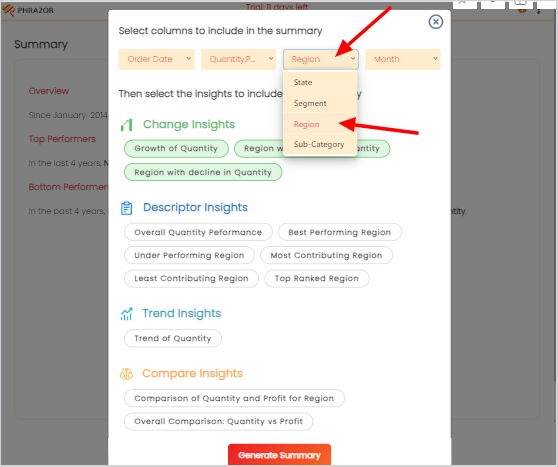
- To change the dimension, click on the third tab and select the dimension for which you want to generate a summary.
- Similarly select the last tab, if you wish to change the period of your generated summary. For Example: Yearly Summary, Monthly Summary etc.
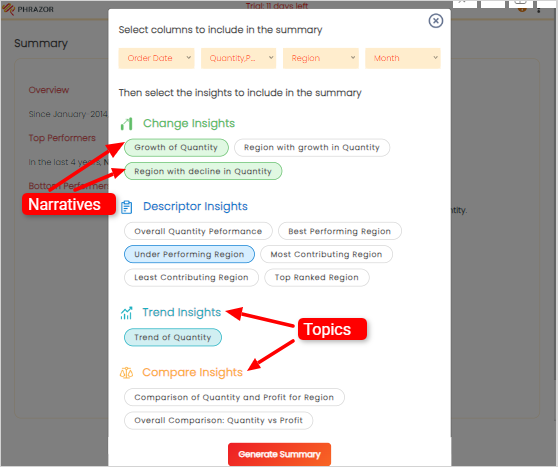
- Select at least 3 different type of narratives from the list of topics to generate a summary.
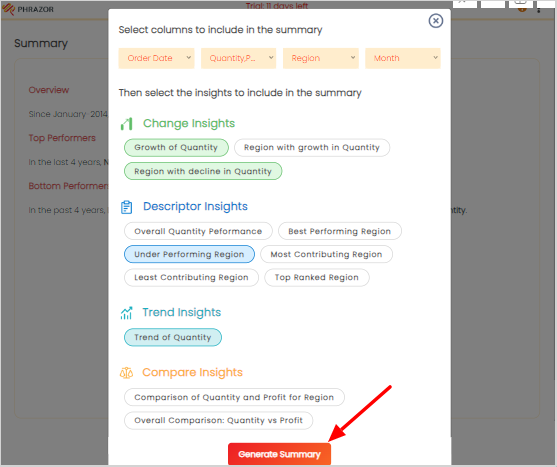
- Click on the ‘Generate Summary’ button to generate summary of your selected topics.
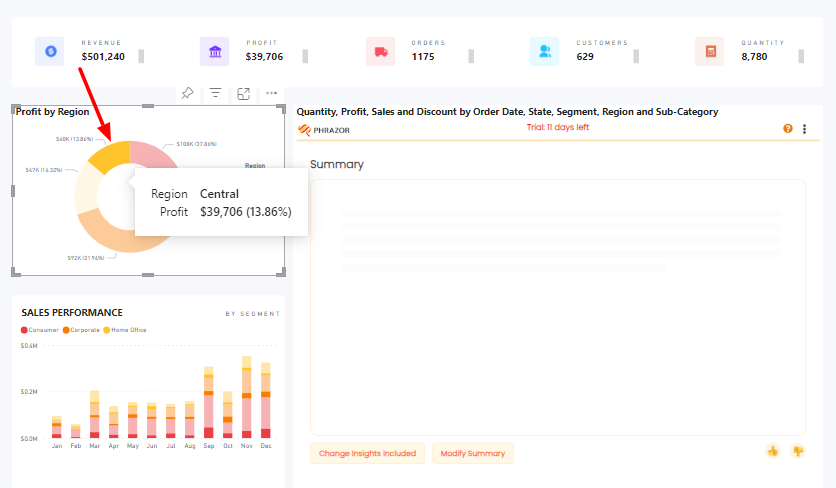
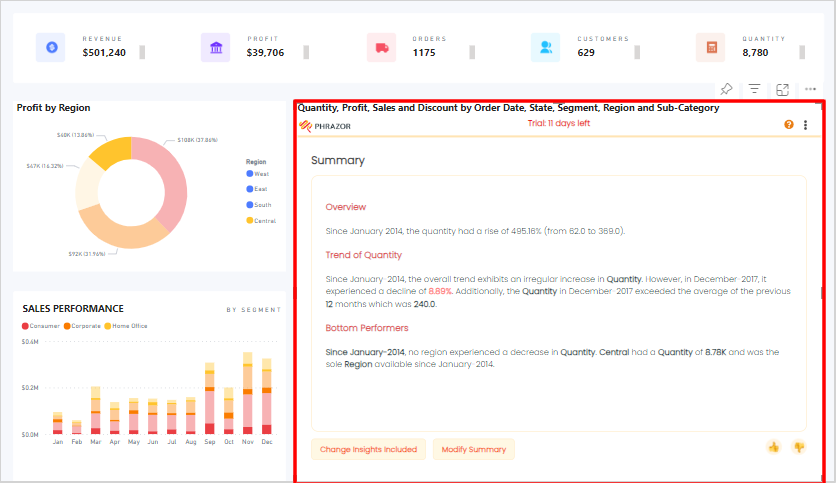
- Generated Summary dynamically interacts with your Power BI Report. Simply click on any visualization on your report and the insights would regenerate based on that visualization.
