Change
Change generates a narrative that analyzes the variance of two measures across a time period.
Example:
- Reasons for growth in Phone Model with respect to Sales
- Reason for Decline in Phone Model Units with respect to store.
To generate 'Change insights' follow the steps given below:
- Go to the Change Tab.
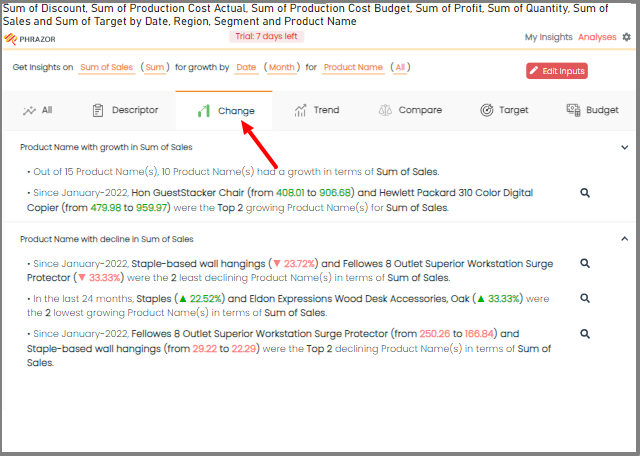
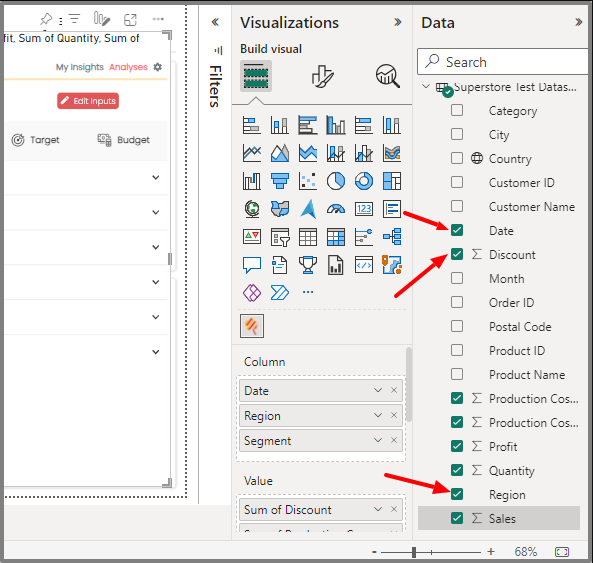
- From the Data Panel, select the desired measure and dimension to generate insights.
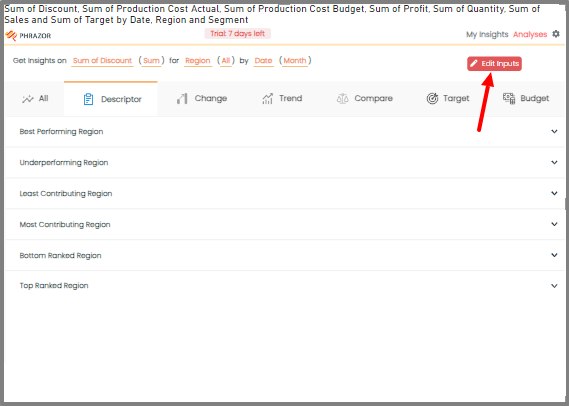
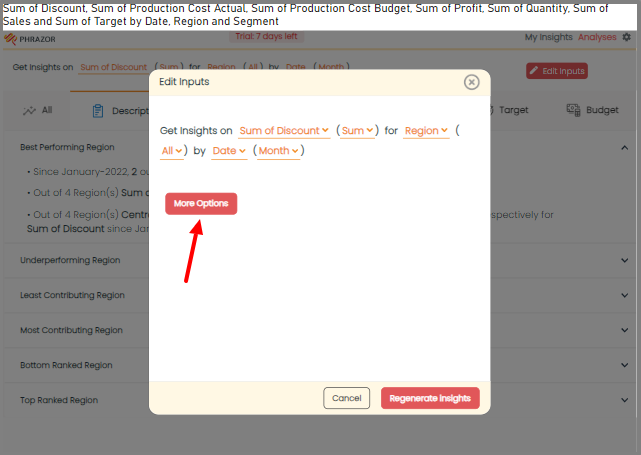
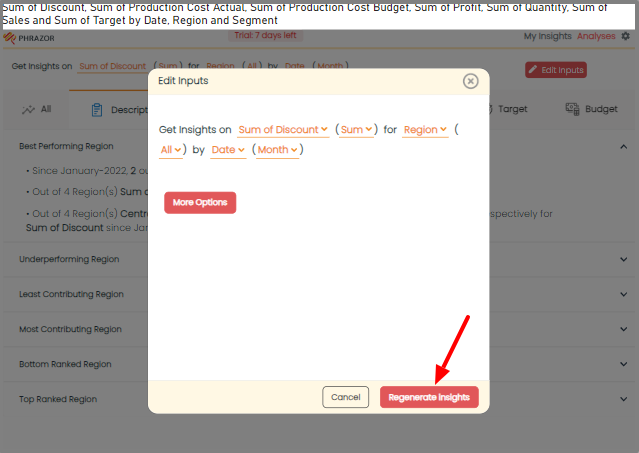
- Click on ‘Edit Inputs’ Button to change the ‘Dimensions’ and ‘Measures’ for which you want to generate insights on.
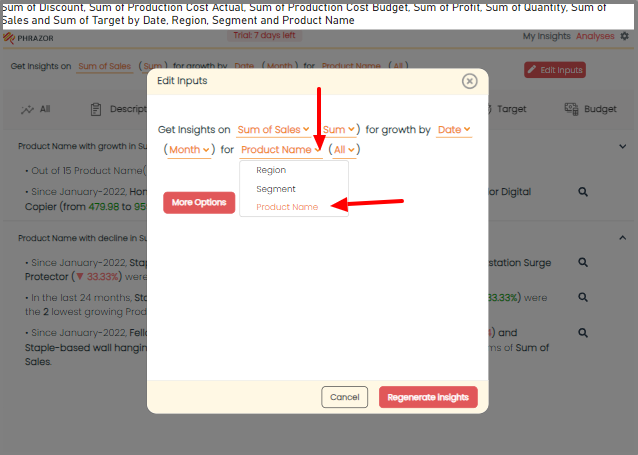
- Click on the v icon to reveal a dropdown menu displaying the list of measures and dimensions you have previously selected. From this dropdown, you can choose the specific measure or dimension for which you would like to generate insights.
Note: You can Change the unit from ‘count’ to ‘Sum’,’Avg’,’Min’ and ‘Max’
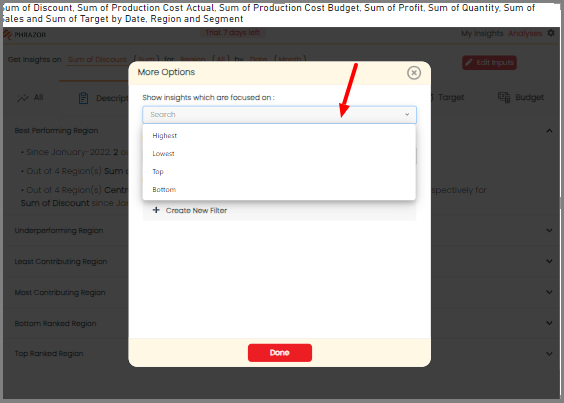
- To add Filters, click on 'More Options'.
- You can filter Insights focused on ‘Highest’, ‘Lowest’, ‘Bottom’ and ‘Top’
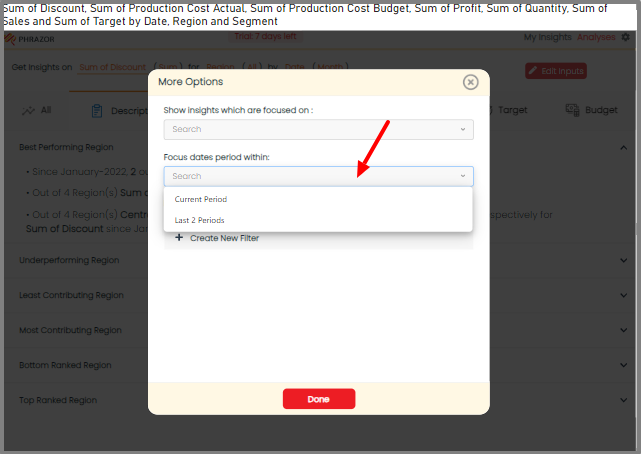
- You can apply Filter on Dates for ‘Current Period’ and ‘Last 2 Periods’
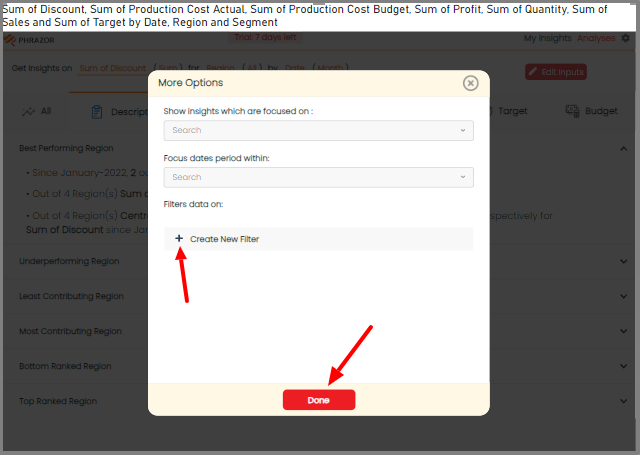
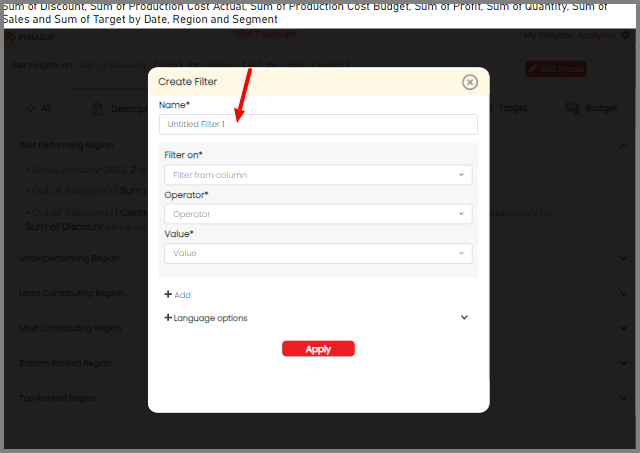
- Once you have finished applying filters, simply click on 'Done.' If you wish to create additional filters, you can select the '➕' icon to create new filter for your insights.
- You can give a new name for your filter.
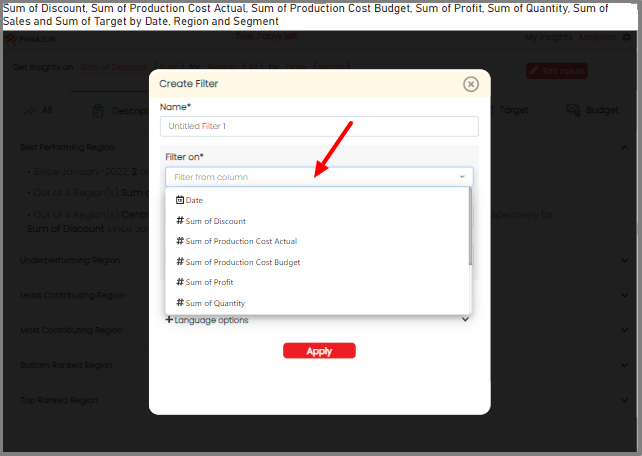
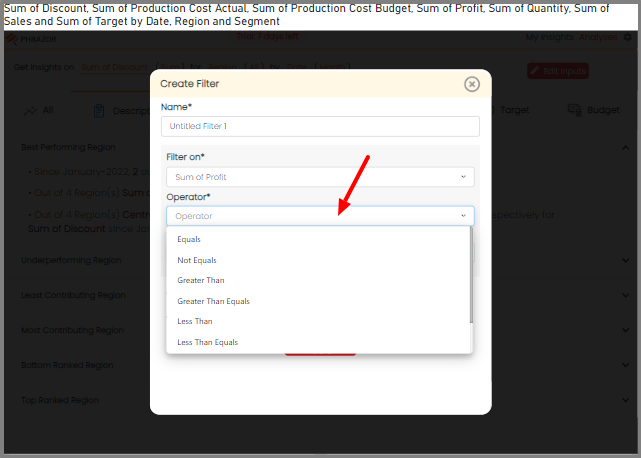
- Click on the “Filter On” option to select the measure or dimension or date for which you want to apply the filter.
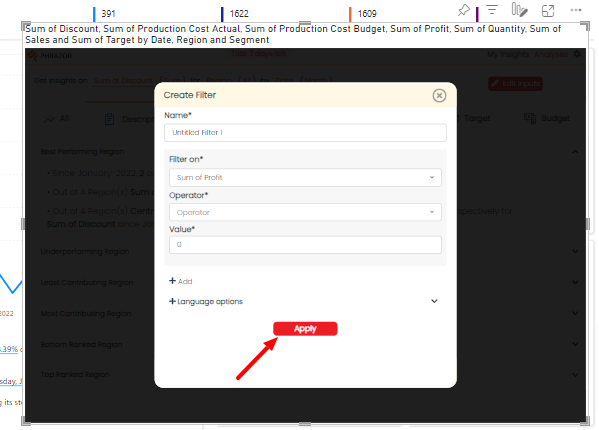
- Click on 'Apply' to save your filter.
- Click on ‘Regenerate Insights’ to generate your Insights.
- Click on the ‘Pin Button’ to pin the insights. All the Pinned insights would be visible on ‘My Insights’ Tab.
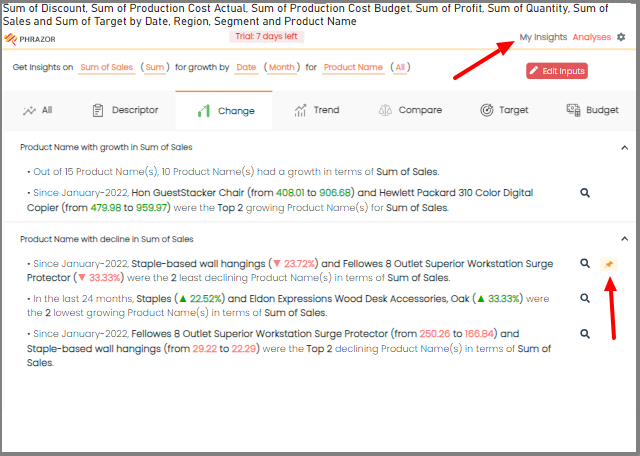
All your Pin Insights are dynamic and interactive with your dashboard.
Start your 14 day free trial today!