Step 4: Generate Hidden/Related Insights from your Report
Join us for the Step 4 of our Series on generating the right report for your business stakeholders using the Phrazor Extension for Tableau.
In this section, we will focus on ‘Hidden / Related Insights’—a remarkable feature designed to enhance usability and add an extra flair to your narratives.
To optimize the effectiveness of these Related Insights, it is crucial to furnish ample context regarding your data. Remember, the richer the context, the more valuable the insights.
The functionality of Related Insights is the culmination of several key elements, including the setting up the Objective for your Report, Correlations, and the Hierarchies.
Let’s learn how to set the objective of your Insights for your Dashboard.
In this step, we begin by identifying the intended audience or consumers(‘Who’s the Reader’) of the reports. This helps determine the appropriate inputs and parameters for generating the reports.
For Example: “This is a “Monthly” summary, for 'Region'. Simply translates to, this is a Report for, say a Regional Sales head, who consumes the report on a Monthly basis.

Next, 'What all do they care about?'
At this stage, we gather information about the user's primary objective, such as increasing Sales or decreasing Profits, with a focus on specific dimension like ‘Region’/’Product Name’

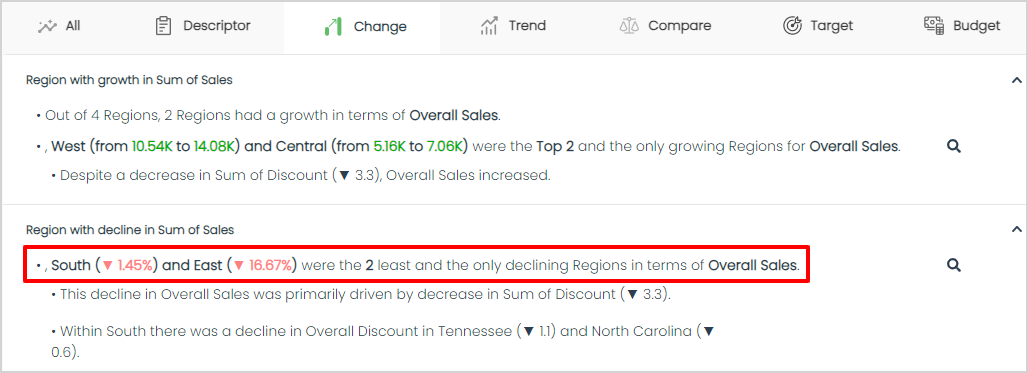
This is also reflected on the way Insights are generated. For instance, as depicted in the aforementioned screenshot, we have specified our objective for the report as 'Increase in Sales' within a specific 'Region'.

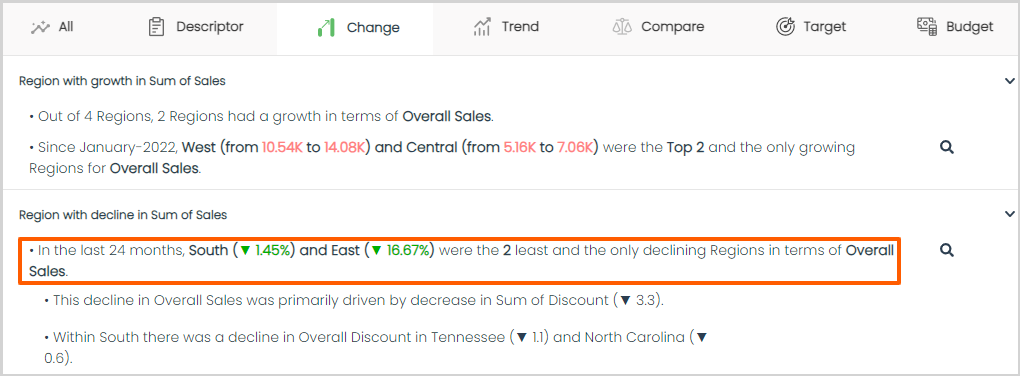
If we change the objective for the report as 'Decrease in Sales' within a specific 'Region'.

The Insights would look like:

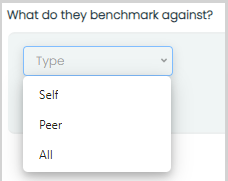
Next, ‘What do they benchmark against?’ is helpful for defining the benchmarking strategy of the user. Meaning, is it Competition that they benchmark against, or is it Self, or is it all Entities.

After selecting any of these, you’re asked what are the Periodic comparison benchmarks.
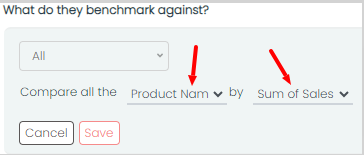
Ex: Compare ‘Product Name’ with ‘Sum of Sales’. Basically, this helps in defining the Comparison period of the Related Insights.

To get more info on how to provide “Correlations” & “Hierarchies” visit the ‘Third Part’ of our series.
Now that all the functionalities are filled, we can start to find 'Hidden/Related' Insights. Here, these extra contexts that you set, help understand the Data more, and hence, enable better Related Insights.
Now that all the functionalities are filled, we can start to find 'Hidden/Related' Insights. Here, these extra contexts that you set, help understand the Data more, and hence, enable better Related Insights.
Next, you just ‘Pin’ Insights to your ‘My Insights’ Tab, and click on the Bulb to see the ‘Related Insights’ get populated.

Explore the Fifth and Last Step of our Series, where we 'Customize our report'
Download our Phrazor Extension for Tableau and start your 14 day free trial from today!