2021-02-15 00:00:00
10 min read
Business Intelligence dashboards and data visualization tools are slowly becoming an integral part of all businesses. There’s an exponential growth in business data and numerous choices for visualization tools available, which help users to make the most out of the data. But these tools often bombard business users and decision-makers with dashboards filled with data points and analytics, which is overwhelming and difficult to understand. To make the data and insights more meaningful, it must be presented using data storytelling.
This article will take you on a journey to understand the need for data storytelling and how it impacts businesses and helps them improve analytics.
The Need for Data Storytelling
The data analytics process consists of the following layers:
Data collection → Data preparation → Data exploration/analysis → Data modelling/presentation → Data deployment
First and foremost, the data is collected and prepared for analysis. It is then used to analyze and interpret deep insights from dashboards using advanced analytics in the data analysis or exploration stage. Once the analysis is ready, it is translated into a format that is consumable by the decision-makers in the data presentation or data modelling stage. The data deployment layer, also known as the last mile of analytics includes collaboration and consumption of data, wherein the insights generated from data are shared with stakeholders and consumed by business users to understand and act on the data.
Business users and stakeholders often fail to get insights in the way they need them and are required to take the help of analysts to understand the data, which leads to a lot of back and forth between analytics teams and their stakeholders. As data becomes a core part of organizations, everyone in the organization needs to know how to communicate the insights from data effectively.
Data storytelling plays an invaluable role in communicating the insights and helping business users to understand and act on their data better. To understand the concept of data storytelling in detail, read this blog: The art of Data-Driven Storytelling - What is it and why does it matter.
The Role of Language in Data Storytelling
“Humans are not ideally set up to understand logic, they are set up to understand stories.”
- Roger C. Schank, Cognitive Scientist
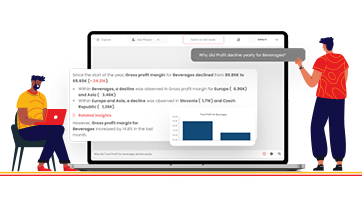
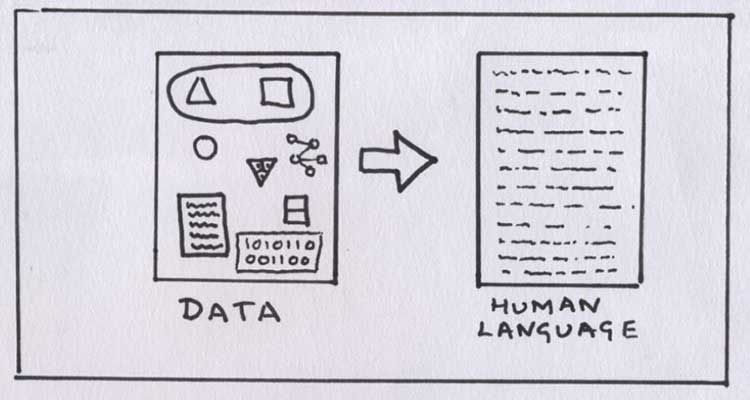
While the data tells you ‘what is happening’, when it is presented in the form of a story, it guides you to an understanding of ‘why it is happening’. It’s all possible using Natural Language Generation (NLG) which translates structured data into written narratives in plain language using Artificial Intelligence.
It assesses, analyzes, and communicates data-rich insights in the form of descriptive narratives. It uses the power of language to automatically transform complex information into simple narratives and bullet points and helps business users to quickly grasp important insights from data. Data stories help users to decipher what is being communicated and helps them make informed business decisions. NLG does it exponentially faster than humans and also eliminates human error, which adds a level of certainty to the analysis.
Why is Data Storytelling Important for Businesses?
There are many methods to communicate insights from data. However, according to a study, a mix of words and visuals drives more engagement than text-only blogs, articles, and write-ups. Harnessing the power of visual analytics and narrative analysis of insights can therefore help businesses to make better sense of their data. Data storytelling has a host of benefits, and when used correctly can help businesses in the following ways:
1. Turn metrics into actionable insights
Storytelling with data empowers businesses to better utilize important metrics by turning them into useful and actionable insights and presenting them in the form of data stories. It analyzes the key performance indicators (KPIs) that align with their core business goals and transforms quantitative data into result-driven narratives. An interactive Business Intelligence (BI) dashboard allows businesses to select the KPIs and uses visuals, charts, and graphs to form a narrative that brings the data to life.
2. Improve processes with plotting
Data stories have a definite plot with a well-constructed beginning, middle, and end. Data storytelling tools, templates, and platforms already have preset themes and formats, which changes the story and visualization based on the input data, and drives the narrative in a way that the message is conveyed in the most effective way possible. Businesses can outline the plot and create a framework by taking into account the primary aim of the data-driven story or report and aligning it with their overall organizational strategy and goals. Populating the plot with the most relevant visualizations and KPIs can help businesses to increase the productivity and efficiency of their processes.
3. Boost communication and engagement
It often gets difficult for companies to maintain an engaging conversation with their clients and stakeholders for a longer time. The key to great communication and engagement is not just limited to compiling all the information in a presentation, but conveying it in a way that is engaging and easy to understand for everyone. With data storytelling, companies can collect and analyze data and present insights in the form of engaging and easy-to-comprehend narratives and visuals. This way, they can better demonstrate the value of their services and build a lasting relationship with their clients and stakeholders.
4. Creates a visual appeal
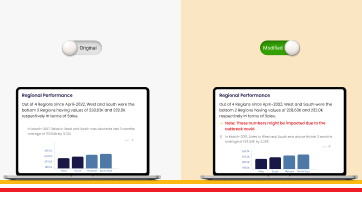
With the attention span of humans constantly decreasing, it has become more important than ever to create a visual appeal to gauge their interest and make an impact. Data-driven storytelling uses visuals such as charts, graphs, heatmaps and narratives for communicating the insights to the end-user. The visuals and narratives enable clients to visualize the story behind their results, which can help in enhancing client reporting.
Data-driven Storytelling Examples with Phrazor
Phrazor leverages Natural Language Generation to help enterprises create unique AI-generated data stories. It analyzes the data, creates visualizations, augments the visuals using narratives, and presents the insights in the form of data stories. Let’s take a look at a few narrative storytelling examples by Phrazor.
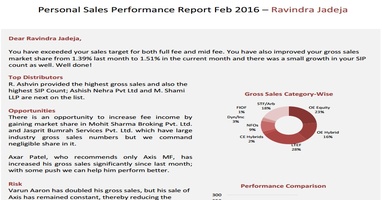
1. Talent Acquisition Report
The talent acquisition department deals with various metrics related to the distribution of vacancies, number of open positions, hiring costs, and efficiencies of hiring teams. Data-driven stories help the talent acquisition teams to effectively keep a track of their performance and make necessary improvements to improve efficiency and quality of hires. Take a look at the data story.


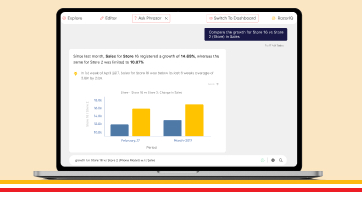
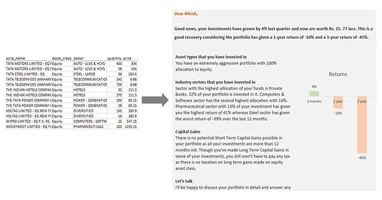
2. Online Store Performance Report
Retail and e-commerce companies need to keep a constant check on their online store performance to drive their marketing and sales campaigns. Using AI-generated stories, they can track the critical metrics and KPIs about page views, competitor analysis, and revenue trends, presented in plain natural language. Here’s how the data-driven story looks:
.png "Online Store Performance Report - Phrazor")

To auto-generate such data stories and reports, check out Phrazor templates available for a range of business functions and industries.
Data storytelling can undoubtedly help businesses to make the most of their data and communicate it better. Phrazor combines the power of language and storytelling with data to create compelling stories from complex datasets in real-time. To know more about how Phrazor can help you become a data-driven business, get in touch with us.
About Phrazor
Phrazor empowers business users to effortlessly access their data and derive insights in language via no-code querying