2022-04-01 00:00:00
7 min read
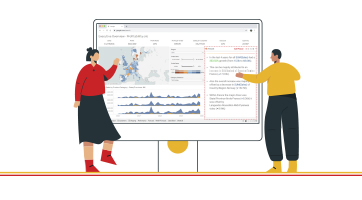
The core value of any dashboard lies in the quality of insights it delivers. Insights are the most critical element of BI reporting, around which all other processes revolve. One of the methods of extracting quality insights from data is to drill deeper into the data at hand.
For example, Sales in Region X have dipped, and you want to know which product, which brand, and which store has been affected the most. Moreover, you need to understand the reason behind the dip in sales. Here, you will perform a drill-down analysis to arrive at the root cause of events.
Drill-down, or data drill-down, is a dashboard function where a user can progress from general information to arrive at very specific information by selecting an entity of their interest and tracing it to the next level.
Drill-down is a function of hierarchical ordering. Consider these examples:
Country → Region → State → City → Market → Segment → Shipping Mode
Region → Market → Country → State → City → Segment → Customer ID → Shipping Mode → Order Date → Order ID
NOT TO BE CONFUSED WITH DRILL-THROUGH, THOUGH
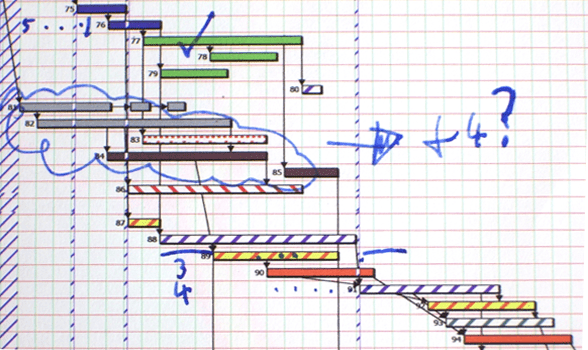
While drill-down moves from one data point to the next, drill-through explores the same set of data in different ways. Suppose that the number of kilometers each footballer in Team A covers in a particular match is presented in a tabular fashion. Drill-through will present the same data through a heat map -

(pic for representational purpose - ResearchGate)
or take you to a separate report where an analysis grid layout will depict which area of the field was covered the most by each player.
In essence, drill-through analyzes the same data point through multiple perspectives in addition to exploring the related insights around it.
THE PROBLEM WITH STANDARD DRILL-DOWNS. BUT BEFORE THAT..
Before we focus on that aspect, let us take a step back, and ask,
how many companies even offer language on their dashboards?
Very few.
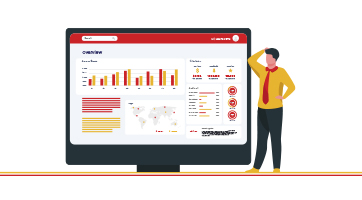
Business users are left to their own devices in trying to make sense of complex dashboard visualizations. Decision-making, where it should have stemmed from a strong understanding of data, is now limited to the intuition and experience of the decision-maker, a risky game to play at best, and certainly ill-advised when competing for the top positions in the market against other data-driven companies.
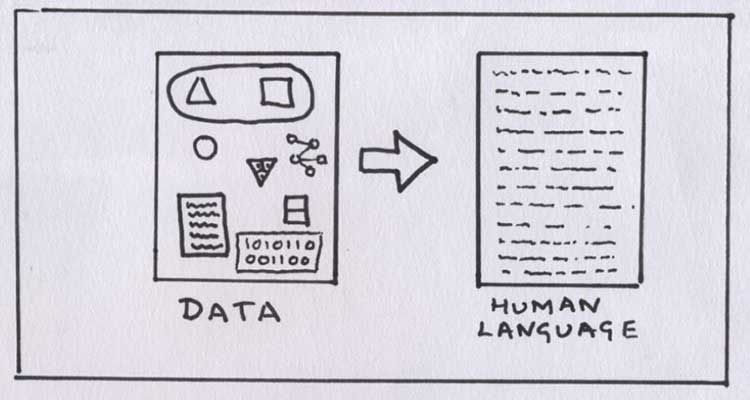
We conclude that the absence of language on dashboards is a white space yet to be explored by business users, and a necessity yet to be provided by most companies offering reasonably advanced dashboard creation tools.
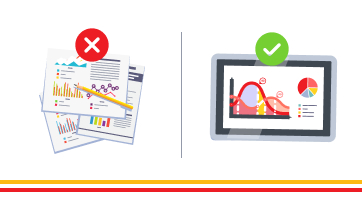
VISUAL DRILL-DOWN VS NARRATIVE-BASED DRILL-DOWN
Now, most drill-downs are visualization-based. This is a natural extension of the above discussion - when the BI Tool itself provides insights in the form of visualizations, the drill-downs simply follow suit.
Narrative-based drill-down helps achieve the last mile in the analytics journey, where the insights derived are able to influence decision-makers into action. Let’s understand how narrative-based drill-down works through a real example and point out its nuanced advantages as we proceed along.
PHRAZOR UNPACKAGED: 6-STEP EXAMPLE OF NARRATIVE-BASED DRILL-DOWN
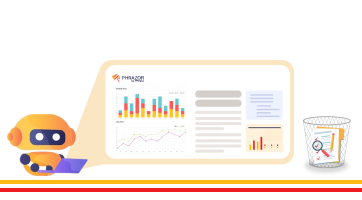
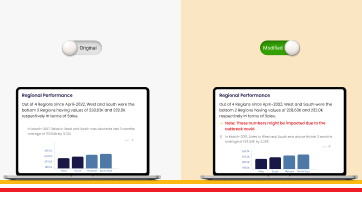
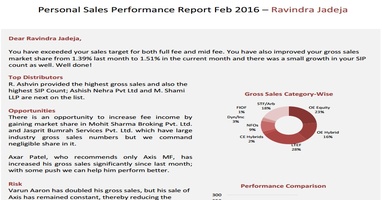
1. Right here we see a Regional Performance Analysis insight ready on the Phrazor screen. The language-based insights (narratives) state that South is the highest growing region. Let’s dig into that

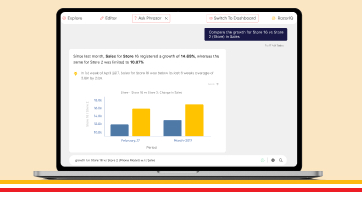
2. Now clicking on the ‘South’ pie quadrant, we get a list of options on the basis of which we can proceed with the drill-down. Brand piques our interest

3. The narratives at the bottom of the screen state very clearly that Samsung is the highest contributor to Sales in the South region, followed by iPhone. Hovering over the Pie Quadrant also displays the same insight

4. Let’s keep drilling to see which Phone Model was the most popular under Samsung. Should you choose a different brand from the dropdown, the insights update according to the filter

5. Pie charts are getting boring. Let’s convert this into a Bar Graph representation. Users can change chart types and back at any stage of the drill-down
Even when you change the chart type, narratives change to adapt to the particular chart type.
Such is the maturity in the narratives that Phrazor provides


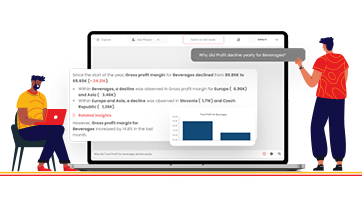
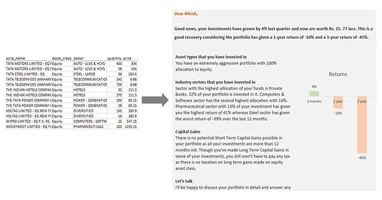
6. Drilling deeper, users can also find out, in real-time -
- which store sold the most units of the most popular phone type
- whether it was a regular sale or sale during a special promotional period
- whether it was sold on installment or lease, and on and on
7. Finally, one can follow the ‘Breadcrumbs’ and revert to any previous data level

TO CONCLUDE
Now that we have visually demonstrated the superiority of Narrative-based drill-down over visualization-based drill-down (oh, the irony), we are sure you would be interested in viewing this and other Phrazor features in action too.
Schedule a no-obligation with us, and we’ll work out how Phrazor best fits your requirements.
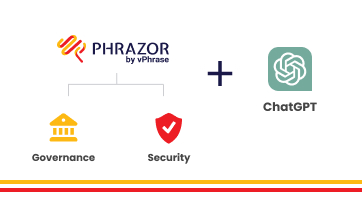
About Phrazor
Phrazor empowers business users to effortlessly access their data and derive insights in language via no-code querying