2015-12-05 00:00:00
2 min read
What do you associate with an influx of charts, graphs, and statistics? Excessive, tedious, overwhelming.
Be it a lead manager in an organization or a stakeholder looking for factual inputs, we all dread data hiding behind wordy technical jargon and indecipherable visualizations.
Sample this; you are looking at investing in shares of a company, struggling to find a fruitful analysis amidst all the verbose, monotonous balance sheets, and income statements, which after a point look the same. Don’t you feel like asking ‘would somebody just explain it in a simple language?’
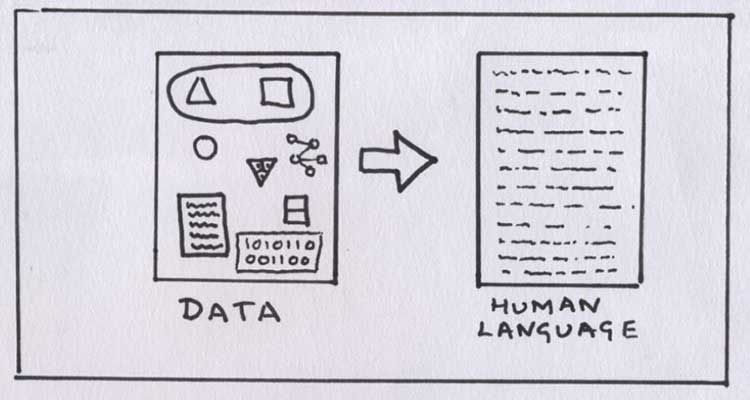
At vPhrase, we transform information into a story and become your bridge between numbers to knowledge. Our young team, comprising of data scientists, developers, and artificial intelligence experts, uses a distinct technology to pull insights from raw data and present them in simple and succinct summaries, augmented by visuals.
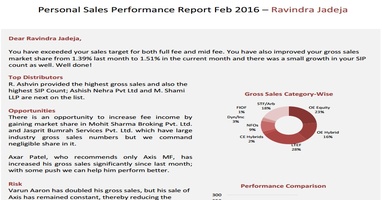
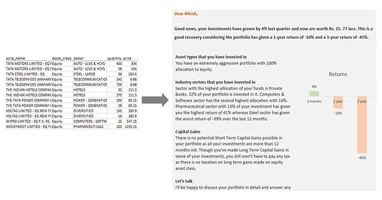
Phrazor serves not just as a robot analyst but can also work as a robot advisor and a robot journalist. Phrazor, an augmented analytics tool can write a match summary just by taking in ball-by-ball scores, while at the same time it can also analyze the quarterly sales figures of an organization; thereby demonstrating a combination of field and target specific approach to interpret and communicate insights.
Our tool is designed to tell data-driven stories behind statistics, written in natural language for humans.
About Phrazor
Phrazor empowers business users to effortlessly access their data and derive insights in language via no-code querying