2019-09-30 00:00:00
6 min read
Portfolio management involves investing in securities to maximize the investor’s returns and minimize the associated risks. A good portfolio analysis report has multiple objectives, and the end goal of portfolio management is to ensure the achievement of the said objectives.
Consequently, a portfolio manager’s job is to understand the client’s objectives, the risk levels he is comfortable with, his vision (whether they want long-term or short-term investments), and his expectations from the portfolio.
An integral part of this process is reporting. To earn the client’s trust and to maintain it in the long-term, as a portfolio manager you need to ensure that your portfolio analysis reports have customized data and insights based on an amalgamation of information from returns, allocation summary, and current risks.
Portfolio Analysis: Status Quo
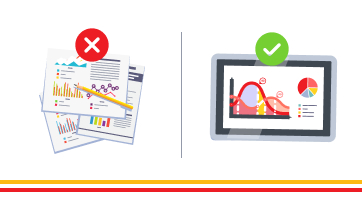
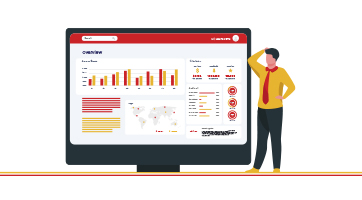
A majority of clients feel that portfolio managers are unable to meet their reporting needs. The reports that clients receive are mostly a bundle of numbers and charts, which make little sense to a client. Clients at times do not understand why structured products and multilayered products are treated differently, the effect of unstable markets on otherwise promising investments. Most investment products have fine details and a complex structure that clients usually do not understand. Moreover, the investment product structures and fine prints change with respect to the market.
On the other hand, the portfolio managers are overburdened by creating reports and maintaining client relationships. Consequently, there is a wide communication gap between the clients and portfolio managers, making life hard for everyone involved.
Further, a client is always at risk of over-diversification and exposure to downside losses. To assure your clients that their investments are well-thought-out and at the minimum possible risk with respect to the market, your most-reliable tool is a well-written and explained report.
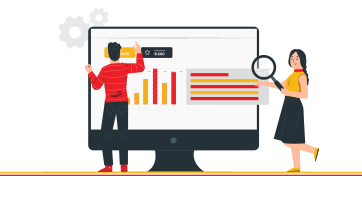
Thanks to increasing competition and client expectations, it is vital for an investment firm to ensure that the clients have a working knowledge of how their wealth is being utilized. An increasing number of organizations are using augmented analytics tools to automate report writing to improve the quality of their reports. Further, reporting automation reduces the manual work required in generating reports and the margin of error significantly.
However, a majority of these software lacks the ability to generate truly customizable reports.
Latest Trends in Portfolio Analysis Reporting for Enterprises
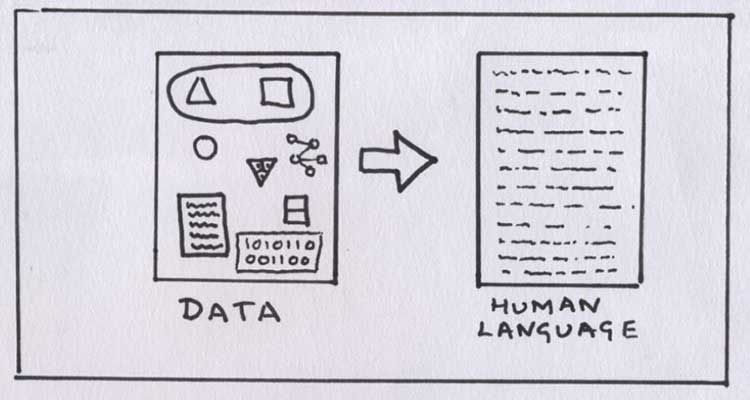
An increasing number of organizations are now depending on BI or reporting tools operating on natural language generation (NLG) technology to extend support for automated report writing. The following are a few trends in the portfolio analysis reporting practiced by leading enterprises in the wealth management industry.

Personalized Portfolio Analysis Reporting
-
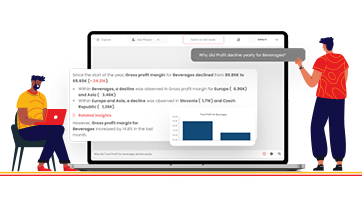
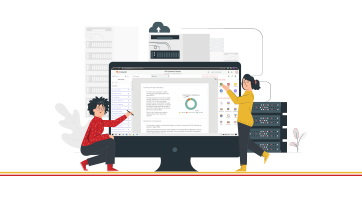
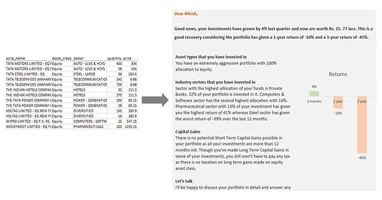
Language Capabilities: Reporting automation tools, more significantly the ones using Natural Language Generation and predictive analysis technology, provide support for automated report writing by converting structured data into easy-to-understand, humanized insights. The tools provide the flexibility of generating these insights in any language of your choice to eliminate the barrier of communication. The efficiency of a reporting automation tool highly depends on its easy-to-understandable linguistic abilities along with maximum data accuracy.
-
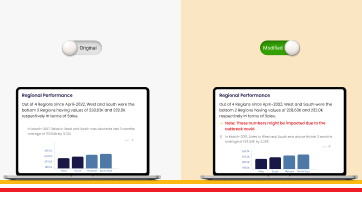
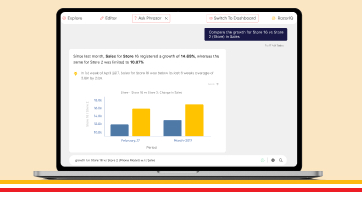
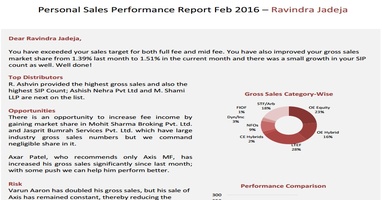
Customized Insights: An efficient reporting tool allows you to create customized reports for your clients. You can tailor these reports to share personalized recommendations in easy-to-digest narratives that are most relevant to your client as per their portfolio. Further, these insights must be highlighted using custom colors. For example, you can have profit statements marked in green and losses marked in red to make the reports skimmable for the clients.
-
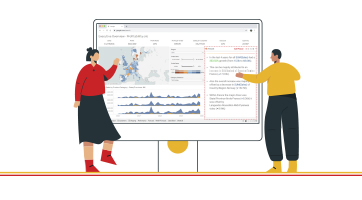
Accessibility Options: These reports are generated in multiple languages and formats (ppt, pdf, audio-visual), which makes it convenient to share them with clients.
Conclusion
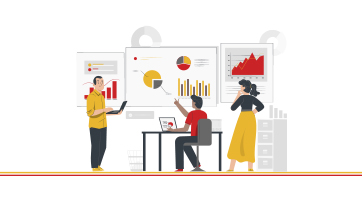
Portfolio managers have various visual formats to represent data and make it understandable. However, the inherent message of charts and graphs may be derived differently by each individual depending on their perspective. On the other hand, clear and concise insights backed by data-driven facts, present a wholesome picture of the clients' portfolio and in turn benefits the portfolio management companies to efficiently cater to the reporting needs of the existing retail investors.
About Phrazor
Phrazor empowers business users to effortlessly access their data and derive insights in language via no-code querying