The Sales team is one of the most data-savvy teams in an organization. The data at a firm’s disposal is often in use by them to have some control over sales performance. The challenge arises if you want your data to do a lot more than simply report the sales figures. And even though most sales folks speak data, the challenge is also knowing where to look and what to track.
When you want your business to reach its maximum potential guided by data, you need the power of Sales Analytics to shine the light and draw out actionable insights from your data.
How?
By using data-driven insights that guide Sales teams:
- Where to spend maximum time and focus, using Market Insights
- Plan and allocate resources, using internal Performance Insights
- Always close, using Customer Insights
What does Sales Analytics do?
Sales analytics ties in all your data, namely sales figures, key metrics, and trends to set objectives for the sales teams and forecast estimated future sales performance. It focuses on bettering the current strategy and developing it further to improve short-term sales performance and improve revenue outcomes in the distant future.
How do you track your company’s Sales Performance?
Sales Analytics can augment sales performance tracking by using sales metrics that are monitored closely and consistently across a wide range of activities occurring in a fast-paced environment. Apart from the usual suspects, you will also find some mentions, monitoring which can help your teams remain focused on the goals and drive action to meet them.
1. Monthly Sales Growth
This is used to measure the month-on-month increase or decrease in sales revenue. Tracking monthly sales growth provides actionable insights on how to optimize sales procedures and strategies. It also provides clarity on which products to prioritize. Monthly sales revenue figures provide near-term insights which can be actioned now. Annual revenue numbers prove useful in tracking the health of your company.
2. Sales Targets
This KPI helps track current performance around set business goals. It compares sales which could be revenue, the number of accounts closed, units sold, or other measures that apply to your team. This KPI helps set attainable sales goals for the team based on historical data. It is also used to track and productivity each month.
3. Sales to Date
This metric compares the total sales for the past quarter or year with that of previous time periods to establish internal historical trends.
4. Sales by Region
This metric provides visibility into regions that are competitive and profitable. It helps track best-performing territories globally. This helps sales teams focus their efforts on regions with more high-purchase instances.
5. Sales per Rep
This KPI measures the ability of sales reps and sales teams to generate revenue. It is important to establish a baseline when making this comparison between sales reps. The baseline should factor in differences such as seniority, location, and if the sales are inbound or outbound. This metric can also be used to encourage growth and improvement in the team.
6. Sales Opportunities
You need to prioritize your sales efforts and pursue leads that are likely to convert. Current sales opportunities indicate the progress you are making in this regard. If a contact responds to the outreach and wants to hear your pitch, you can gauge if the lead matches your customer profile.
Tracking sales opportunities helps teams gain insights into the efficacy of their own sales process which involves outreach efforts, connecting with the right people, and making an impressive sales pitch.
7. Product Performance
This sales KPI ranks your products based on revenue performance to know which products are selling well and which are missing the mark. It is important to track product performance over time to get inputs on market/industry-wide changes, overall demand for your product, customer profiles, and sales strategies. offering. This KPI helps bring changes in the sales process with a focus on individual products.
8. Lead Conversion Rate
This metric indicates the number of leads converting to sales. The lead conversion rate is an important performance indicator for the entire sales team. It also aligns the efforts of the sales and marketing teams to optimize performance and improve customer experience.
You can use this metric to understand why you converted some customers and lost the others. It provides insights into areas where your process is not working and needs adjustments to target more qualified leads to reach your ideal customer.
9. Sell-through Rate
This metric applies to physical goods. It tracks your sales versus the total inventory shipped to you from the manufacturer. It is a very critical sales metric because it helps you monitor the efficiency of your supply chain and also assists in sales forecasting. In the age of e-commerce platforms, this metric is especially useful for physical stores.
If the sell-through rate is very low, you need to investigate further to get to the heart of the problem. This rate alerts you to the fact that something is wrong but it won’t tell you what.
For that, you need to segment the analysis based on the product, to know the sales performance of each product - which is doing well or poorly. You can adjust your inventory accordingly and cut down on the risk of carrying a slow-moving product. Also, take into account seasonal trends influencing product sales.
10. Average Purchase Value
One of the most basic strategies to increase revenue is to sell more to each customer. The Average Purchase Value metric tracks the average purchase of each customer. This input helps understand customer buying behavior which contributes to developing sales strategies that include incentivizing customers who spend more, to purchase higher-end products. If you can increase the value of individual purchases, you are essentially compounding the outcomes of your sales efforts.
11. Cannibalization Rate
This metric measures the impact that new products and offerings have on the sales revenue of existing products. When a business has new product releases, it might take away the focus and demand from existing products especially if they have similar value propositions. The new product may end up cannibalizing an existing product.
Monitoring product cannibalization in sales analytics helps provide customer experience. A situation such as this is very challenging for the sales and marketing teams aligned with promoting and selling the existing product line. A common approach to reducing the impact of cannibalization is to offer the new line of products to existing customers at an incentive or discounted rate.
12. Quote-to-Close / Sales Closing Ratio
This metric measures the volume of quotes sent compared to the volume of deals signed or closed. It is a very good tool to monitor sales productivity and the ability of the rep or team to close a deal. It provides insights into the efficiency of your sales process and the type of leads. It helps you focus on qualified prospects within your sales funnel.
Important KPIs For Sales Directors For Managers For Sales Reps
Sales Targets
Sales to Date
Sales by Region
Sales Opportunities
Sales Rep Productivity & Leaderboard
Sales by Contact Method
Revenue Forecasts
Retention & Churn Rates
Reach & Response Rates
Product Performance
Pipeline Value
Net Promoter Score (NPS)
Monthly Recurring Revenue (MRR) &
Annual Recurring Revenue (ARR)
Monthly Sales Growth
Monthly Onboarding & Demo Calls Booked
Lead Conversion Rates
Customer Acquisition Cost (CAC)
Customer Lifetime Value
Calls & Emails Made (per Rep)
Calls & Emails Made
Average Purchase Value
Average Profit Margin
Average Conversion Time
Average Time to Conversion
Average Follow-up Attempts
How to align Sales Teams with Sales Analytics?
A well-thought-out Sales Analytics strategy could be the most lethal weapon in your sales toolkit. It brings clarity and helps teams focus on doing what they do best. It helps increase your performance through optimized sales activities and increase in accountability.
Despite the obvious benefits it can be challenging for many sales teams to report on data required for Sales Analytics which may appear to not be a high-priority event. They tend to focus more on revenue-generating activities which directly impact sales performance figures and bring them closer to meeting their targets.
How do you align your sales analytics in a manner that allows your best sales reps to keep selling while accelerating their efforts and not obstructing them?
Sales Analytics Reports on Dashboards
Incorporating sales analytics within easy-to-use and intuitive dashboards is a solution. The dashboard should clearly communicate the insights from the analytics. This can be done using very traditional tools like Google Sheets, PowerPoint, or Excel. You could also opt for Business Intelligence tools (like Phrazor) which are a lot more efficient and can be used as an integrated plug-and-play feature or a standalone solution.
Sales Analytics on Leaderboards
Sales folks are a competitive lot and the idea of a leaderboard displaying their performance numbers can get the competition going. A leaderboard is generally shown on a TV set located close to the Sales teams in office. It is a great way to help teams track their performance and progress in real-time. It provides transparency, accountability, and fosters a data-driven culture, ensuring sales teams make informed business decisions.
If you are interested in exploring a customized solution relevant to your firm
About Phrazor
Phrazor empowers business users to effortlessly access their data and derive insights in language via no-code querying
You might also find these interesting
Recommended Reads

Phrazor Visual Product Update: October 2023
Our latest Phrazor Visual update brings improved language quality, key takeaways, and actionable insights.

Why Phrazor and ChatGPT are a match made in Heaven
Learn how Phrazor SDK leverages Generative AI to create textual summaries from your data directly with python.
What is Power BI DAX - A Complete Guide
Power BI DAX formulas have a well-defined structure that combines functions, operators, and values to perform data manipulations.

How to Create a Data Model in 6 Simple Steps
Learn the basics of how to create a working data model in 6 simple steps.

Create Tableau Heatmap in simple steps
Heatmap transforms data into a vibrant canvas where trends and relationships emerge as hues and intensities. In this blog we will learn how to create a heatmap on Tableau in easy steps.

Top 7 Tableau tips and tricks for Tableau developers
Supercharge your Tableau reports with our seven expert Tableau tips and tricks! We will share tips on how to optimize performance and create reports for your business stakeholders.
Complete Guide to Master Power Query
What is Power Query? Power Query allows user to transform, load and query your data. Read our complete guide to know more about Power Query.
What is Data Catalog and how to implement it
Data Catalog is an organized inventory of an company's data assets, providing a centralized repository that facilitates data discovery, understanding, and management.
Top 7 Power BI tips and tricks for Power BI developers
Supercharge your Power BI reports with our seven expert Power BI tips and tricks! We will share tips on how to optimize performance and create reports for your business stakeholders.

Generate Smart Narratives on Power BI
Learn the smarter and easier way to generate Narrative Insights for your Power BI dashboard using the Phrazor Plugin for Power BI.

5 Common BI Reporting Mistakes to Avoid
Learn how to avoid the top common BI reporting mistakes and how to leverage your data to the maximum usage.

5 Ways to Improve Your Business Intelligence Reporting Process
Learn how to establish a consistent reporting schedule, work on data visualization, automate data collection, identify reporting requirements, and identify KPIs and metrics for each report.
Automate your talent acquisition report with Phrazor
Discover how to enhance your talent acquisition reporting with BI tools like writing automation and NLG. Learn about Phrazor’s capabilities and its integration with Power BI.
Benefits of Automated Financial Reporting for Enterprises
Learn about the benefits of automated financial reporting and the role of natural language processing (NLP) in its success in this informative blog.
How Phrazor eliminates ChatGPT's data security risks for Enterprises
Learn how Phrazor enhances data security for enterprises by separating sensitive information from ChatGPT's queries. Generate insights with confidence.

Supply Chain Analytics and BI - Why They Matter to Enterprises
Learn how supply chain analytics and business intelligence (BI) can help organizations optimize their operations, reduce costs, and improve customer service.

How Phrazor leverages ChatGPT for Enterprise BI
Discover how Phrazor, an enterprise business intelligence platform, harnesses the power of ChatGPT, a large language model, to generate insightful reports and analyses effortlessly. Learn more about the benefits of using Phrazor's AI-powered capabilities for your business.
The Future of BI Reporting - Trends and Predictions for 2023
Explore the new trends and predictions for the Business intelligence Industry and How AI is disrupting the BI industry and the traditional methods.

Narrative Science has Shut Down. Here's an Interesting, and Similar, Alternative For It
If you're a Narrative Science customer, you may have recently found yourself in a tough spot. In December 2022, Narrative Science was acquired by Salesforce for Tableau, and their services have now been stopped. So where does that leave you?

Why it Makes Sense for Small Enterprises to Opt for Self-Service BI Early
If we are to learn from the best, it’s evident that data is the fuel to propel your growing organization to greater heights. Google used what is termed ‘people analytics’ to develop training programs designed to cultivate core competencies and behavior similar to what it found in its high-performing managers. Starbucks...

Improving Dashboard Functionality Through Design
A look at the multiple design and customization options Phrazor provides to dashboard creators, to help drive engagement, adoption, and more.

Conducting Advanced Conversational Queries on a BI Tool Effortlessly
Natural Language Querying, or NLQ, is one of the primary methods through which a business user can synergize his vast experience and answers from the company’s data to arrive at the best decisions, without wasting time on either learning or executing anything new.

How Pharma can Optimize Sales Performance Using Business Analytics
The Pharma play is smartening up with automated insights to drive effectiveness in Sales and Marketing efforts.

Impact of Good Insights in Business
Why do managers not use data or insights? Can insights be bad? What is a good insight? Read on for answers.

How Marketing Analytics Optimizes Marketing Efforts
Know for sure if your marketing efforts are hitting bullseye or missing the mark.

How HR Analytics can find the Right Talent and drive Business Productivity
Gain complete visibility of the human resource lifecycle to drive business value.
Business Intelligence vs Data Analytics vs Business Analytics
What is the best fit for your business needs? Let’s find out.

Applications of NLQ in Marketing
NLQ holds the potential to completely revolutionize the way the marketing department works, helping them improve lead generation, measure campaign performance, sift through web analytics, and create effective content.

Does Your BI Tool Have These 4 Must-Have Features?
Although BI tools are being widely indoctrinated into a company’s tech arsenal, its usage and adoption still leaves a question mark on the validity of the BI investment made. Some of the common reasons why Business Intelligence tools are not being adopted company-wide are:
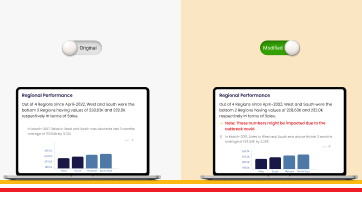
Taking Collaboration To The Next Level With Modified Reports
Phrazor provides a simple solution: create an additional, ‘modified’ report that holds all your comments and edits, without altering the original report whatsoever.
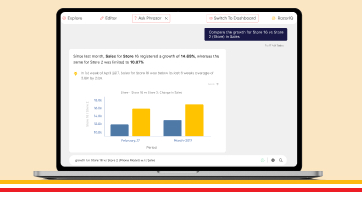
How To Create A Dashboard By Just Chatting - In 4 Steps
Due to the cumbersome process of communicating with tech teams, business users have to wait for weeks or days to get even ad-hoc queries answered. The dependency on data analysts is just far too great. Additionally, most dashboards in use today are of a static nature..

Why Narrative-Based Drill-Down is Superior to Normal Drill-Down
Narrative-based drill-down helps achieve the last-mile in the analytics journey, where the insights derived are able to influence decision-makers into action. Let’s understand how narrative-based drill-down works through a real example...

Why Phrazor’s Conversational Analytics Chatbot is a Cut above other Chatbots
The querying capabilities of Ask Phrazor when compared to the other solutions available in the market, those from Tableau and Power BI, for instance, leave clear daylight between Ask Phrazor and the others. Here are 5 features that showcase how Ask Phrazor is a cut above the rest:
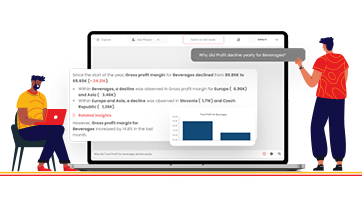
Don’t Ask Your IT Team, Ask Your Data - Dashboard Conversation Interface for Business Users
Conversational analytics on dashboards for business users means they can conduct queries and ad-hoc queries on dashboards in real-time, without the need to revert to tech-based teams and wait for days or weeks for reverts.

Self-Service BI - The Way Forward For Both Analysts and Business Users
The most important question that business users should be asking when making important decisions is this: does my dashboard enable me to take decisions independently?

5 Top Management Reporting Expectations And How To Meet Them
Reports created for the top management do not fulfill their purpose of being useful in strategic decision-making. So what are the top management reporting expectations, and how do you meet them? Read on:

How Phrazor Helps Improve Sales for the Pharmaceutical Industry
Each report is embedded with language-based insights that make data easy to interpret. These auto-generated insights not only explain the data visible on the dashboard but also mine the underlying data pool to surface hidden insights that would have gone completely unnoticed otherwise.
Here’s why you need to add a Language Extension on Tableau
Even though Tableau Dashboards are loaded with exciting features, and new ones constantly added, organizations cannot justify the cost of acquisition of such high-investment BI Tools due to their inability to contribute to ROI. In other words, business owners are not always able to use dashboards to arrive at all-important decisions.

Why should the Financial Services Industry invest in a Self-Service BI Tool
One would conclude that while there is nothing wrong with traditional BI tools, it is the evolution of data in terms of size and complexity and how organizations use it today that necessitates analytics which is beyond the scope of traditional BI tools.

How a Self-Service BI Tool can help the Financial Services industry in Market Intelligence Reporting
Market intelligence reports are to enhance your business intelligence and decision-making. Self-service BI tools can help financial service providers expand their offerings, discover unexplored markets, become more efficient.
Are your dashboards failing to perform? 10 ways to make your dashboards perform optimally
Dashboards curate comprehensive data analysis and enable users to customize the information they want to be displayed. This article describes the reasons why dashboards seem ineffective and how you can avoid these problems.
Data Storytelling: Communicate Insights from Business Data Better with Stories
Data-driven storytelling makes data and insights more meaningful. This article describes the need for data storytelling, how it impacts businesses and helps in improving the communication of insights.

Why Augmented BI is a must-have for your business?
Learn how Business Intelligence has evolved into self-service augmented analytics that enables users to derive actionable insights from data in just a few clicks, and how enterprises can benefit from it.

How is Natural Language Generation Enhancing Processes in the Media & Entertainment Sector
Natural Language Generation plays a vital role for media and entertainment companies to create the right customer experience. It improves processes, boosts customer engagement, and gain a competitive advantage.
Making Sense of Big Data with Natural Language Generation
Businesses often face challenges in combing and mining the right data and translating it into useful and actionable insights. NLG uses the power of language to automate this process and bridge the gap. Read this article to find out how NLG can be effectively used to analyze big data.

How Natural Language Generation is Transforming the Pharma Industry
Natural Language Generation is transforming the pharma industry by increasing the efficiency of clinical trials, accelerating drug development, improving sales and marketing efforts, and streamlining compliance.
Introducing Phrazor: Everything you Need to Know About This Smart BI Tool
Meet Phrazor, our self-service BI platform that turns complex data into easy-to-understand language narratives.

Taking Financial Analysis and Reporting to the Next Level with Natural Language Generation
NLG in finance simplifies data management by automating time-consuming and repetitive workflows and increasing the speed and quality of analytics and reporting.

Phrazor Automates Commentary on IPL Matches for a Leading Media & Publishing Company
Phrazor collaborates with Hindustan Times and ventures into a new product use case, wherein it can help publishing companies and journalists in automating written content.

Going beyond Business Intelligence with Augmented Analytics
Explore how business intelligence systems have evolved into augmented analytics, allowing businesses to become smarter and more proactive.

How is Reporting different from Business Intelligence?
Discover the nuances of reporting, business intelligence, and their convergence in business intelligence reporting.

The art of Data-Driven Storytelling - What is it and why does it matter
Learn why data-driven storytelling, and not just data analytics is necessary to drive organizational change and improvement.

How Big Data Analytics aids Media & Entertainment
Discover how big data analytics is helping media companies to maximize their entertainment value and enhance their business performance.

Applications of AI in the media & entertainment industry
From the way creators conceptualize media content to the way consumers consume it, AI is seeping every aspect of the media and entertainment industry.

How Natural Language Generation Is Helping Democratize Business Intelligence
Discover the role of natural language generation in democratizing business intelligence and building a fully data-driven enterprise.

It's time to upgrade your BI with natural language generation
Learn how natural language generation can help organizations extract the maximum value from their business intelligence tools.

How AI can add value to Human Resource Management
Explore the different ways enterprises can use artificially intelligent automation for HR functions.

How AI is Transforming HR Management
See how AI-enabled HR automation is helping enterprises to enhance the end-to-end employee lifecycle.

4 Ways Big Data Analytics is Revolutionizing the Healthcare Industry
Learn how the use of big data is impacting the different aspects of healthcare, from diagnosis and drug discovery to treatment and post-treatment care.

The Role of NLG-based Reporting Automation in the Pharma Industry
Explore the leading present-day use cases of natural language generation-driven reporting automation in the pharmaceutical industry.

Develop a data-literate enterprise with NLG
Learn how Natural Language Generation (NLG) technology can aid in achieving data literacy across your enterprise to enable data-driven decision making.

Data literacy - the skill growing enterprises must watch out for!
Discover why enterprises must understand data literacy and its importance to be prepared for the data-driven future.

Giving Financial Reports a Facelift with Reporting Automation
Discover how financial institutions are leveraging artificial intelligence and machine learning-enabled natural language generation tools to automate their reporting processes.

Automation in Banking and Financial Services: Streamlining the Reporting Process
Explore how the Banking and Financial Services industry is making the most of automated reporting.

Personalize your Portfolio Analysis Reports for unique Customer Experience
Learn how to capitalize on creating a unique customer experience for your investors with personalized portfolio analysis reports & natural language generation.

Simplifying Portfolio Analysis Reports using Automation
Here’s how reporting automation is changing the face of portfolio analysis reporting for better customer experience and understandability.

Predictive Analytics: What is it and why it matters!
Here's how organizations are making the most of predictive analytics to discover new opportunities & solve difficult business problems.
Business Intelligence, the modern way!
Read more to find out the modern approach to Business Intelligence and Reporting

How AI is transforming Business Intelligence into Actionable Intelligence
Check out how advanced AI technology like Natural language generation is transforming BI Dashboards with intelligent narratives.

Data summarization – the way ahead for businesses
Here's how proper summarization and analysis of data can help increase business value and ROI.

NLG modernizing businesses!
Here's how leading businesses are approaching reporting and analytics using advanced artificial intelligence like Natural Language Generation (NLG).
Demystifying Big Data Analytics
Read more to find out how Big Data Analytics can help businesses recalculate risk portfolios, help detect fraudulent behavior, and determine the root causes of failures and defects in near real-time.
Business Intelligence Decoded
Business intelligence is a data-driven process for analyzing and understanding your business so you can make better decisions based on real-time insights. Here's how it can benefit your teams and organization.

What are Intelligent Narratives and why every business needs them?
Here's how intelligent narratives supplement the graphical elements on dashboards and add more value to the information communicated by giving a quick account of the data, deriving key insights, and aid faster, better decision making.

AI revamping the educational space
Read how AI and machine learning are paving their way in the educational space by overcoming the traditional challenges of the industry.

vPhrase emerges as the winner at the Temenos Innovation Jam in Hong Kong
Here's how Phrazor demonstrated its capabilities of auto-generating a full-fledged report in just 5 seconds and won the Temenos Innovation Jam in Hong Kong.

Can software write content for you?
Let's understand how and why website and blog content can be auto-generated using Phrazor

The media and entertainment industry goes gaga over AI
Read along to understand how AI is influencing the media and entertainment industry.

AI to revolutionize the banking sector
Here’s how AI is coming to become the most defining technology for the banking industry.

Business problems that AI can solve
Unleash the potential of AI to overcome business challenges and climb higher up the ladder of success.

NLU vs NLP vs NLG: The Understanding, Processing and Generation of Natural Language Explained
Read along to understand the difference between natural language processing, natural language understanding and natural language generation.

AI is all set to empower medicos
AI is a boon to the healthcare industry. Let us understand how it can help medical professionals do their jobs better.

Top use cases in automated report writing
The power of natural language generation in robotizing report writing should be realized in different fields. Here’s why and how.
Striking a chord with your customers, the AI way
Here's how AI-backed solutions can help finance companies improve their customer service with language-based portfolio statements.

Will automation lead to mass unemployment?
Will this wave of Artificial Intelligence and Robotics cause mass unemployment or will it in fact create more jobs? Let's find out...

Leveraging Artificial Intelligence to augment Big Data Analysis
Check out how the painstaking tasks of analyzing massive volumes of data and generating reports can be automated for a boost in productivity and revenue.

5 technological breakthroughs that will benefit your business right away
Do more with less with these 5 tech breakthroughs which you can implement in your business right away.
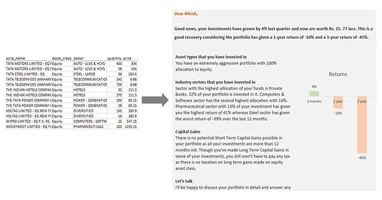
When indecipherable numerical tables turned into personalized investment stories
Natural Language Generation systems help you convert complex portfolio statments in easy to understand investment stories. Read the article to check an example and also how it's done.
A Quick Guide to Natural Language Generation (NLG)
Natural Language Generation (NLG), an advanced artificial intelligence (AI) technology generates language as an output on the basis of structured data as input.

Artificial Intelligence Decoded
Artificial intelligence (AI) is a field of computer science focused at the development of computers capable of doing things that are normally done by people, things that would generally be considered done by people behaving intelligently.

What is Big Data and how to make sense of it?
Big Data can be described as data which is extremely large for conventional databases to process it. The parameters to gauge data as big data would be its size, speed and the range.

Would you please explain it in human
Phrazor, an augmented analytics tool uses advanced AI technology and machine learning to pull insights from raw data and present them in simple and succinct summaries, augmented by visuals.


