2021-07-14 00:00:00
12 min read
The global Business Intelligence market is expected to rise to USD 33.3 billion by 2025 from USD 23.1 billion in 2020, amounting to an impressive CAGR of 7.6%, according to a report by Markets and Markets.
The underlying reason behind the BI market size expansion is simple: businesses run on data, and decisions made based on that data decide the success or failure of an organization. It is in this pursuit that BI Solutions such as dashboards are pervasive across industries. Dashboards are an efficient route to make sense of data; they transform data into coherent visuals. Such visuals serve as a solid base for strategic decision-making and revenue optimization.
Tableau Dashboards
Tableau is one of the most recognized and popular data visualization tools in the entire world, competing with the likes of Google Charts, Grafana, Power BI, Qlikview, and more.
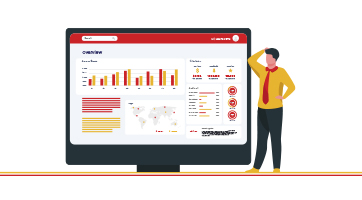
Tableau dashboards provide users with advanced visualizations like motion charts, bullet charts, treemaps, box-plots as well as the basic pie charts and histogram views.
The Dashboard Catch
Even though Tableau Dashboards are loaded with exciting features, and new ones constantly added, organizations cannot justify the cost of acquisition of such high-investment BI Tools due to their inability to contribute to ROI. In other words, business owners are not always able to use dashboards to arrive at all-important decisions.
And that is where the crux of the problem lies: why are dashboards not able to serve as a basis for effective decision-making?

Businesses find themselves in a dilemma - on one hand, the need for dashboards is absolute. On the other hand, they are not able to use them for decision-making.

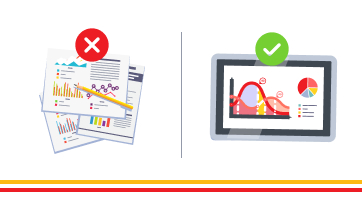
Here’s What Is Missing
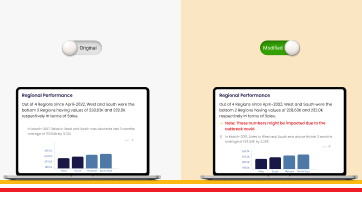
Business leaders need to understand the importance of adding language extensions to dashboards. Right now, they are either working with visual-heavy dashboards that require further decoding, or their BI tool lays down surface information. Businesses think that their dashboard is providing insights, while it often reveals little more than the obvious. To unearth hidden trends from complex datasets and to establish interrelation between data points, language extensions are needed.
Plugging The Gap
Till here, we have established two points: Tableau is an awesome data visualization BI tool that is not only embedded but also updated with the latest features for users to benefit from. All that’s needed to complete a Tableau dashboard presentation then is the addition of language extensions to the Tableau dashboard. That’s the second point.
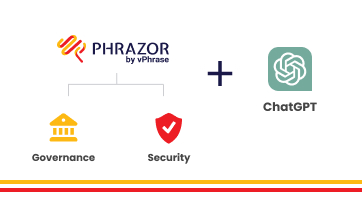
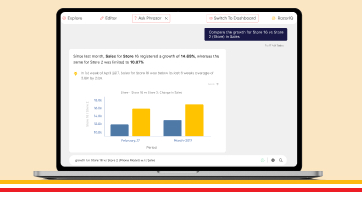
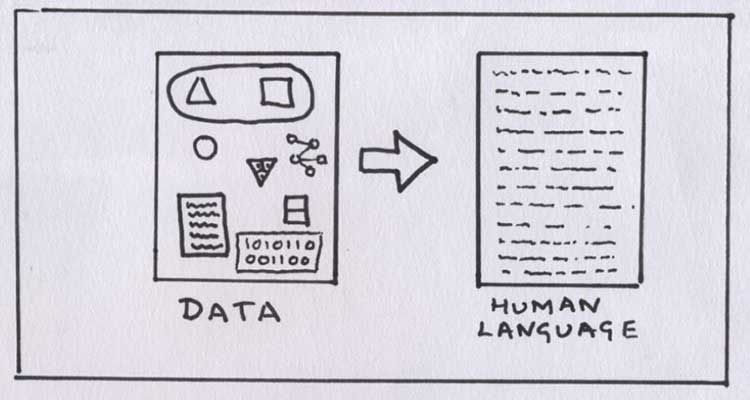
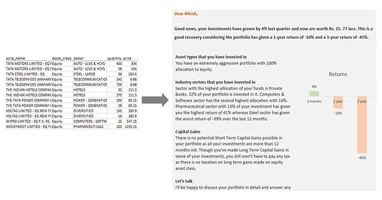
Phrazor for Tableau Extension uses data-to-language conversion technology to create custom narratives around visual data in simple language. It is an ideal extension to the visual-heavy Tableau dashboard, helping generate rich insights through automated data interpretation. Such accurate analyses and insight generation minimizes the possibilities of data misinterpretation and makes decision-making effective and fast.
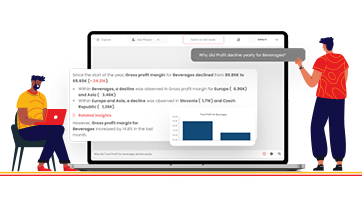
One outstanding advantage for businesses is the reduced dependency on technological experts to further decode the data. Leaders and managers need not possess any special skill to operate the extension; basic computing skills suffice. Phrazor Extension for Tableau also extracts answers to specific questions on demand, in addition to suggesting its own relevant question set on the dashboard.
Managers can now redeploy skilled resources towards higher-value tasks. Organizational productivity shoots up as a result.
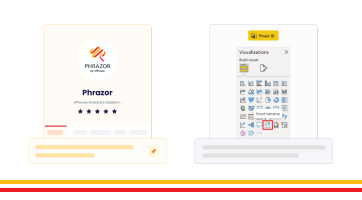
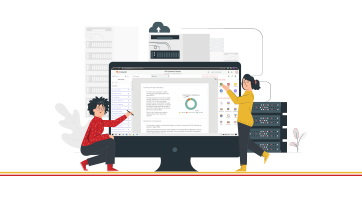
Easy Integration
Integrating Phrazor into Tableau is a 10-minute task. Open a Tableau workbook and double-click ‘Extensions’ under the ‘Objects’ tab. Select Phrazor as your option and add it to the Tableau dashboard.
Generating insights through language extensions from visual-heavy dashboards in a lucid, narrative format was never this easy. Use Phrazor Language Extension to discover hidden trends, ask relevant questions, and understand data in its totality for progressive decision-making.
Check out this video to watch how Phrazor's Natural Language Generation Plugin can enhance the value of your Tableau Dashboard with language narratives.
Try Phrazor for free and let our solutions team demonstrate how Phrazor Language Extension adds value to Tableau Dashboard.
About Phrazor
Phrazor empowers business users to effortlessly access their data and derive insights in language via no-code querying