2023-03-10 00:00:00
7 min read
Current State of BI Reporting
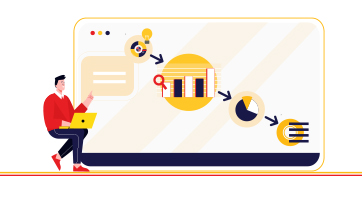
In recent years, BI reporting has undergone significant changes, with the advent of AI and machine learning, cloud-based analytics, real-time data, and embedded insights in other applications. These trends have led to a greater emphasis on data visualization, storytelling, and collaboration, with businesses seeking to turn raw data into actionable insights that can drive growth and innovation.
However, with the ever-increasing volume and complexity of data, the current state of BI reporting is more critical than ever before. In this blog, we will examine the current state of BI reporting and explore the latest trends and predictions for 2023, highlighting the opportunities and challenges that businesses may face.
Latest Trends in BI Reporting
As we look towards the future of BI reporting, there are several trends that industry experts in CPG, Pharma, Media, Finance, and other industries should be aware of.
Increased Adoption of AI and Machine Learning

One of the most significant trends is the increased adoption of Artificial Intelligence (AI) and Machine Learning (ML) in BI reporting. AI and ML can analyze large data sets and provide accurate predictions and insights that can help businesses make more informed decisions.
Here are some examples of how AI and ML are being used in BI:
Predictive analytics
Predictive analytics uses machine learning algorithms to analyze historical data and identify patterns that can be used to predict future outcomes. For example, a company can use predictive analytics to forecast sales or identify customers who are at risk of churning OR a retailer may use predictive analytics to forecast demand for a particular product based on historical sales data, weather patterns, and social media trends.
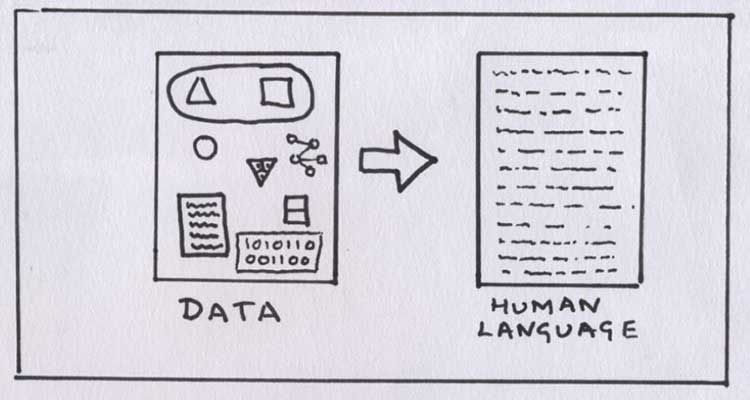
Natural Language Processing (NLP)
Natural Language Processing (NLP) uses Artificial Intelligence (AI) to enable computers to understand, interpret, and generate human language. In Business Intelligence (BI), NLP can be used to analyze unstructured data such as customer reviews, social media posts, and AI-generated voiceovers for videos and emails. This analysis can help identify customer sentiment and provide insights into customer behavior.
Automated Data Analysis
AI-powered BI tools can analyze large volumes of data quickly and accurately, which can save analysts significant time and effort. For example, an AI-powered tool can automatically identify trends, patterns, and anomalies in data, which can help businesses make data-driven decisions faster.
Personalization
AI and ML can help companies personalize their offerings and recommendations to customers. For example, e-commerce companies can use ML to analyze customer data and recommend products based on their past purchases or browsing behavior.
Fraud Detection
AI and ML can help detect fraudulent activities by analyzing large volumes of data in real-time. For example, banks can use AI to monitor transactions and identify suspicious patterns that may indicate fraud.
Greater Emphasis on Data Visualization and Storytelling

Another trend is a greater emphasis on data visualization and storytelling, which makes it easier for non-technical users to understand complex data.
Here are some ways Data Visualization and Storytelling are used in BI.
Interactive Dashboards
Interactive dashboards allow users to interact with data in real-time and gain insights into key performance indicators (KPIs) and trends. These dashboards can be customized to meet the needs of different stakeholders, from executives to front-line employees.
Infographics
Infographics use visual elements such as charts, graphs, and diagrams to present complex data in a simple and easy-to-understand format. For example, a sales team may use an infographic to present sales data to clients or to track their own progress towards monthly targets.
Storytelling with Data
Storytelling with data is a technique that combines data visualization with narrative storytelling to help people understand complex data sets. This approach can help businesses communicate insights more effectively and persuade stakeholders to take action based on data-driven insights.
Integration with Collaborative Tools and Cloud Based BI

Additionally, integration with collaborative tools, such as team messaging and project management software, will enable better communication and decision-making. Cloud-based BI reporting and analytics will also become increasingly popular, enabling businesses to access and analyze data from anywhere.
Here are some examples of how Collaborative Tools and Cloud Based BI are being used in BI:
Collaborative Workspaces
Collaborative workspaces such as Microsoft Teams, Slack, and Google Workspace allow teams to communicate and collaborate on projects in real-time. These tools can be integrated with cloud-based BI solutions to enable teams to share data, reports, and insights with each other and work together to make decisions based on data.
Collaborative Data Sharing
Cloud-based BI solutions allow teams to share data and insights with each other, regardless of their physical location. This can improve collaboration between departments, enable real-time decision-making, and foster a data-driven culture within the organization.
Mobile BI
Cloud-based BI solutions can be accessed from anywhere, including mobile devices. This enables employees to access real-time data and insights from the field, on the go, or from home, which can improve productivity and decision-making.
Cloud-Based Analytics
Cloud-based analytics solutions, such as Amazon Web Services, Google Cloud Platform, and Microsoft Azure, allow businesses to store and analyze large volumes of data in the cloud. This provides businesses with greater flexibility and scalability, enabling them to quickly scale their BI infrastructure as their data needs grow.
Real-time Analytics and Actionable Insights

Furthermore, the growth of embedded BI, where insights are delivered within other applications, will allow businesses to integrate data analysis more seamlessly into their workflows. Finally, there will be a focus on real-time analytics and actionable insights, which can help organizations respond quickly to changing market conditions and take advantage of emerging opportunities.
Here are some examples of how businesses are using real-time analytics and actionable insights in BI:
Real-time Dashboards
Real-time dashboards provide businesses with up-to-date information on key performance indicators (KPIs) and trends. This enables teams to identify issues and opportunities in real-time and make faster, more informed decisions.
Automated Alerts
Automated alerts can be set up to notify stakeholders when key metrics or thresholds are met or exceeded. This enables businesses to respond quickly to issues or opportunities as they arise.
Streaming Analytics
Streaming analytics use real-time data from sensors, social media, and other sources to identify trends and patterns in real-time. For example, a logistics company may use streaming analytics to monitor the location and condition of goods in transit and identify potential issues before they become problems.
Actionable Insights
Actionable insights provide businesses with clear, specific recommendations for action based on data-driven insights. For example, a marketing team may use actionable insights to optimize their advertising spend based on which campaigns are driving the most sales.
Predictions for the Future of BI Reporting in 2023
Looking ahead to the future of BI reporting in 2023, there are several exciting predictions that industry experts in CPG, Pharma, Media, Finance, and other sectors should be aware of.
Personalized and Context-Aware BI Reporting

We think that BI reporting will become more personalized and context-aware, tailored to individual user needs. This will allow businesses to extract insights and derive value from their data more efficiently. Additionally, we expect to see continued democratization of data, with more non-technical users able to access and analyze data. This will enable a broader range of stakeholders to make data-driven decisions and reduce the burden on technical experts.
This trend towards personalized and context-aware BI reporting is driven by several factors:
The need for more targeted insights
As businesses generate ever-growing amounts of data, it's becoming increasingly difficult to extract meaningful insights without spending significant time and resources. By tailoring BI reporting to individual users, businesses can focus on providing the most relevant insights for each stakeholder, enabling them to make better decisions more quickly.
The rise of self-service analytics
As data analysis tools become more accessible and user-friendly, non-technical users are increasingly able to explore data and generate their own insights. By providing personalized and context-aware BI reporting, businesses can make this process even easier and more effective.
The increasing importance of data-driven decision-making
In today's rapidly changing business environment, decisions need to be made quickly and with confidence. By providing personalized and context-aware BI reporting, businesses can ensure that stakeholders have the information they need to make data-driven decisions with confidence.
A study by Gartner found that by 2022, 90% of corporate strategies will explicitly mention information as a critical enterprise asset and analytics as an essential competency. This indicates that businesses are increasingly relying on data and analytics to inform their strategic decisions, highlighting the importance of personalized and context-aware BI reporting.
Overall, the move towards personalized and context-aware BI reporting is a natural evolution of the BI industry, as businesses seek to extract more value from their data while reducing the burden on technical experts. By enabling a broader range of stakeholders to access and analyze data, businesses can gain new insights and make more informed decisions, driving better outcomes and improved performance.
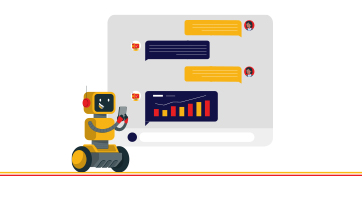
Advancements in Natural Language Processing and Conversational BI

Advancements in natural language processing and conversational BI will also make it easier to ask questions and get answers from data, further enhancing accessibility.
According to a report by Grand View Research, the global conversational AI market is expected to reach $16.2 billion by 2026, growing at a CAGR of 30.2% from 2019 to 2026. This suggests that businesses are increasingly adopting conversational BI as a way to improve accessibility and efficiency in data analysis.
Here are a few reasons why these advancements are significant:
Improved accessibility
Conversational BI allows non-technical users to interact with data using natural language, eliminating the need for technical skills or knowledge of complex data structures. This makes data analysis more accessible to a broader range of stakeholders, including business users, executives, and decision-makers.
Increased efficiency
With conversational BI, users can get answers to their questions quickly and without having to manually search for data or build complex queries. This saves time and increases efficiency, enabling users to make faster decisions and respond more quickly to changing business needs.
Better insights
NLP can help users uncover insights that might be missed with traditional data analysis tools by enabling them to ask more nuanced questions and explore data in a more intuitive way. This can lead to better decision-making and improved business outcomes.
Enhanced collaboration
Conversational BI can facilitate collaboration between technical and non-technical stakeholders by enabling them to communicate more effectively and share insights more easily. This can help break down silos within organizations and enable more effective decision-making.
Augmented Reality and Virtual Reality in Data Visualization and Exploration

Another exciting development is the increased use of augmented reality and virtual reality in data visualization and exploration. This will allow businesses to interact with their data in new and immersive ways, potentially leading to new insights and discoveries.
Here are some ways through which AR and VR can be used in Data Visualization and Exploration
Enhanced data exploration
AR and VR can provide a more immersive and interactive way to explore data. For example, a company called Immersion Analytics has developed a virtual reality platform called "Data in VR" that enables users to visualize and manipulate large data sets in 3D space, potentially leading to new insights and discoveries.
According to a report by Grand View Research, the global augmented reality and virtual reality in the healthcare market is expected to reach $5.1 billion by 2025, growing at a CAGR of 30.2% from 2020 to 2027.
Improved decision-making
AR and VR can provide a more intuitive and engaging way to present data, potentially leading to better decision-making. For example, a company called Virtualitics has developed an augmented reality platform that enables users to interact with data in a 3D space, allowing them to see patterns and relationships that may not be immediately apparent in traditional 2D charts and graphs.
Real-time data visualization
AR and VR can provide a more dynamic and interactive way to visualize real-time data. For example, a company called Scope AR has developed an augmented reality platform that enables users to overlay real-time data onto physical objects, allowing them to see changes and trends in the data in real time.
According to a report by ABI Research, the enterprise AR market is expected to reach $21.2 billion by 2024, with industrial and manufacturing applications driving the majority of growth.
Integration with Blockchain Technology for Improved Data Security and Trust

As per the recent growth in the industry, integration of BI reporting with blockchain technology has the potential to enhance data security and trust, which are critical factors for businesses in today's digital landscape.
By leveraging the decentralized and secure nature of blockchain technology, businesses can ensure the confidentiality, integrity, and availability of their data, which can help to build trust with stakeholders and support their overall business objectives.
Immutable record-keeping
Blockchain technology is based on a decentralized, immutable ledger that records transactions in a tamper-proof and transparent manner. This makes it an ideal solution for businesses that need to maintain a secure and auditable record of their data. By integrating blockchain technology into BI reporting, businesses can ensure that their data is being recorded in a secure and immutable manner, which can help to build trust with stakeholders.
Increased data privacy
Blockchain technology enables businesses to maintain control over their data by using encrypted keys and permissioned access. This means that only authorized parties can access and modify the data, which can help to protect sensitive business information from unauthorized access or data breaches.
Improved data integrity
By leveraging blockchain technology, businesses can ensure the accuracy and consistency of their data by creating a secure and tamper-proof record of it. This can help to build trust with stakeholders by providing a verifiable and auditable source of truth for the data.
Enhanced security
Blockchain technology provides a high level of security by using encryption and distributed consensus mechanisms to protect data from unauthorized access or modification. This can help to prevent data breaches and other security incidents, which can have serious consequences for businesses in terms of financial losses, reputational damage, and legal liabilities.
Challenges in BI Reporting
While the future of BI reporting is full of promise, there are also several challenges that businesses will need to address.
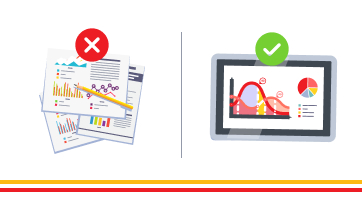
Ensuring Data Quality and Governance
One of the most significant challenges is ensuring data quality and governance to ensure accurate and reliable BI reporting. This includes addressing issues such as data silos, inconsistent data formats, and incomplete or inaccurate data.
At the same time, businesses must also be mindful of opportunities for data-driven innovation and competitive advantage, leveraging the latest trends and tools to gain insights and make more informed decisions.
Balancing Data Privacy and Ethics with Business Needs
It is also crucial to balance data privacy and ethical considerations with business needs, ensuring that data is used ethically and transparently, and that the appropriate security measures are in place to protect sensitive data.
By navigating these challenges and opportunities effectively, businesses can gain a competitive advantage in their respective industries, make more informed decisions, and achieve their goals.
The future of BI reporting is looking bright and full of potential. We have seen a shift towards more personalized and context-aware BI reporting, an increased focus on democratization and accessibility of data, and exciting developments in augmented reality and natural language processing.
As we anticipate the future of BI reporting, one tool that industry experts should be aware of is Phrazor.
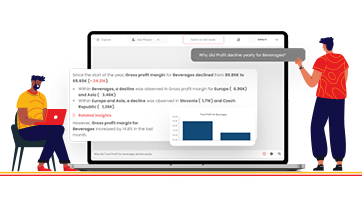
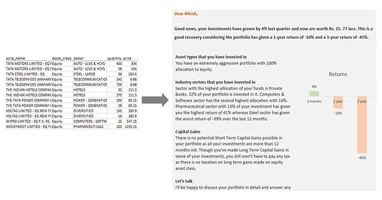
Why Phrazor is the best Natural Language Generation Insight tool out there!
Our AI-powered tool can enhance BI reporting by providing insights in a natural language format, making it easier for non-technical users to understand complex data. With Phrazor, users can generate automated reports, dashboards, and presentations, allowing businesses to quickly and easily access key insights.
Phrazor also integrates seamlessly with collaborative tools, enabling better communication and decision-making.
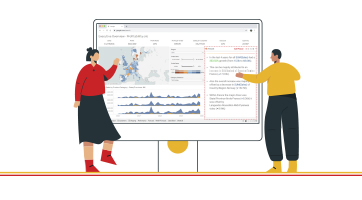
As a cloud-based tool, Phrazor allows businesses to access and analyze data from anywhere, ensuring that they can stay up-to-date on their performance. Additionally, our embedded BI capabilities mean that users can integrate Phrazor insights into other applications, enabling businesses to leverage data analysis more seamlessly into their workflows.
Finally, with Phrazor's real-time analytics and actionable insights, businesses can respond quickly to changing market conditions and take advantage of emerging opportunities. Our tool can provide accurate predictions and insights that can help businesses make informed decisions and stay competitive in their respective industries.
As we look towards the future of BI reporting in 2023, we encourage businesses in CPG, Pharma, Media, Finance, and other sectors to stay ahead of the curve by embracing the latest trends and technologies and preparing for a data-driven future. By doing so, they can unlock the full potential of their data, stay ahead of the competition, and achieve their business objectives.
About Phrazor
Phrazor empowers business users to effortlessly access their data and derive insights in language via no-code querying