2022-06-15 00:00:00
11 min read
The Sales team is one of the most data-savvy teams in an organization. The data at a firm’s disposal is often in use by them to have some control over sales performance. The challenge arises if you want your data to do a lot more than simply report the sales figures. And even though most sales folks speak data, the challenge is also knowing where to look and what to track.
When you want your business to reach its maximum potential guided by data, you need the power of Sales Analytics to shine the light and draw out actionable insights from your data.
How?
By using data-driven insights that guide Sales teams:
- Where to spend maximum time and focus, using Market Insights
- Plan and allocate resources, using internal Performance Insights
- Always close, using Customer Insights
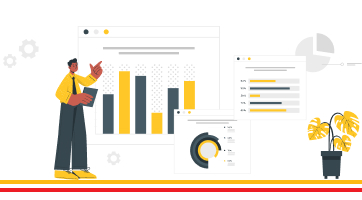
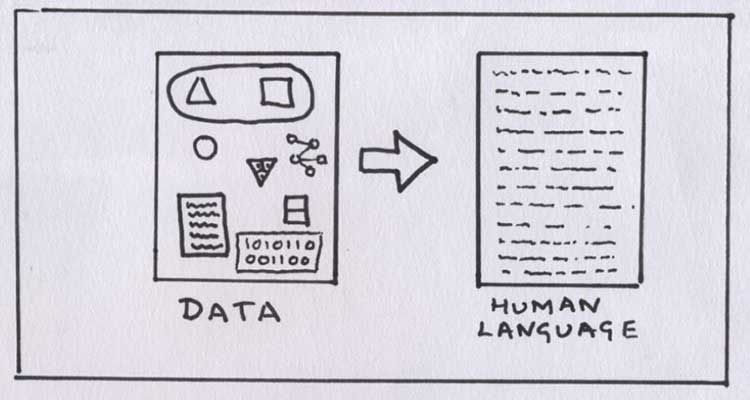
What does Sales Analytics do?
Sales analytics ties in all your data, namely sales figures, key metrics, and trends to set objectives for the sales teams and forecast estimated future sales performance. It focuses on bettering the current strategy and developing it further to improve short-term sales performance and improve revenue outcomes in the distant future.
How do you track your company’s Sales Performance?
Sales Analytics can augment sales performance tracking by using sales metrics that are monitored closely and consistently across a wide range of activities occurring in a fast-paced environment. Apart from the usual suspects, you will also find some mentions, monitoring which can help your teams remain focused on the goals and drive action to meet them.
1. Monthly Sales Growth
This is used to measure the month-on-month increase or decrease in sales revenue. Tracking monthly sales growth provides actionable insights on how to optimize sales procedures and strategies. It also provides clarity on which products to prioritize. Monthly sales revenue figures provide near-term insights which can be actioned now. Annual revenue numbers prove useful in tracking the health of your company.
2. Sales Targets
This KPI helps track current performance around set business goals. It compares sales which could be revenue, the number of accounts closed, units sold, or other measures that apply to your team. This KPI helps set attainable sales goals for the team based on historical data. It is also used to track and productivity each month.
3. Sales to Date
This metric compares the total sales for the past quarter or year with that of previous time periods to establish internal historical trends.
4. Sales by Region
This metric provides visibility into regions that are competitive and profitable. It helps track best-performing territories globally. This helps sales teams focus their efforts on regions with more high-purchase instances.
5. Sales per Rep
This KPI measures the ability of sales reps and sales teams to generate revenue. It is important to establish a baseline when making this comparison between sales reps. The baseline should factor in differences such as seniority, location, and if the sales are inbound or outbound. This metric can also be used to encourage growth and improvement in the team.
6. Sales Opportunities
You need to prioritize your sales efforts and pursue leads that are likely to convert. Current sales opportunities indicate the progress you are making in this regard. If a contact responds to the outreach and wants to hear your pitch, you can gauge if the lead matches your customer profile.
Tracking sales opportunities helps teams gain insights into the efficacy of their own sales process which involves outreach efforts, connecting with the right people, and making an impressive sales pitch.
7. Product Performance
This sales KPI ranks your products based on revenue performance to know which products are selling well and which are missing the mark. It is important to track product performance over time to get inputs on market/industry-wide changes, overall demand for your product, customer profiles, and sales strategies. offering. This KPI helps bring changes in the sales process with a focus on individual products.
8. Lead Conversion Rate
This metric indicates the number of leads converting to sales. The lead conversion rate is an important performance indicator for the entire sales team. It also aligns the efforts of the sales and marketing teams to optimize performance and improve customer experience.
You can use this metric to understand why you converted some customers and lost the others. It provides insights into areas where your process is not working and needs adjustments to target more qualified leads to reach your ideal customer.
9. Sell-through Rate
This metric applies to physical goods. It tracks your sales versus the total inventory shipped to you from the manufacturer. It is a very critical sales metric because it helps you monitor the efficiency of your supply chain and also assists in sales forecasting. In the age of e-commerce platforms, this metric is especially useful for physical stores.
If the sell-through rate is very low, you need to investigate further to get to the heart of the problem. This rate alerts you to the fact that something is wrong but it won’t tell you what.
For that, you need to segment the analysis based on the product, to know the sales performance of each product - which is doing well or poorly. You can adjust your inventory accordingly and cut down on the risk of carrying a slow-moving product. Also, take into account seasonal trends influencing product sales.
10. Average Purchase Value
One of the most basic strategies to increase revenue is to sell more to each customer. The Average Purchase Value metric tracks the average purchase of each customer. This input helps understand customer buying behavior which contributes to developing sales strategies that include incentivizing customers who spend more, to purchase higher-end products. If you can increase the value of individual purchases, you are essentially compounding the outcomes of your sales efforts.
11. Cannibalization Rate
This metric measures the impact that new products and offerings have on the sales revenue of existing products. When a business has new product releases, it might take away the focus and demand from existing products especially if they have similar value propositions. The new product may end up cannibalizing an existing product.
Monitoring product cannibalization in sales analytics helps provide customer experience. A situation such as this is very challenging for the sales and marketing teams aligned with promoting and selling the existing product line. A common approach to reducing the impact of cannibalization is to offer the new line of products to existing customers at an incentive or discounted rate.
12. Quote-to-Close / Sales Closing Ratio
This metric measures the volume of quotes sent compared to the volume of deals signed or closed. It is a very good tool to monitor sales productivity and the ability of the rep or team to close a deal. It provides insights into the efficiency of your sales process and the type of leads. It helps you focus on qualified prospects within your sales funnel.
Important KPIs For Sales Directors For Managers For Sales Reps
Sales Targets ![]()
![]()
![]()
Sales to Date ![]()
![]()
![]()
Sales by Region ![]()
![]()
![]()
Sales Opportunities ![]()
![]()
![]()
Sales Rep Productivity & Leaderboard ![]()
![]()
![]()
Sales by Contact Method ![]()
![]()
![]()
Revenue Forecasts ![]()
![]()
![]()
Retention & Churn Rates ![]()
![]()
![]()
Reach & Response Rates ![]()
![]()
![]()
Product Performance ![]()
![]()
![]()
Pipeline Value ![]()
![]()
![]()
Net Promoter Score (NPS) ![]()
![]()
![]()
Monthly Recurring Revenue (MRR) &
Annual Recurring Revenue (ARR) ![]()
![]()
![]()
Monthly Sales Growth ![]()
![]()
![]()
Monthly Onboarding & Demo Calls Booked ![]()
![]()
![]()
Lead Conversion Rates ![]()
![]()
![]()
Customer Acquisition Cost (CAC) ![]()
![]()
![]()
Customer Lifetime Value ![]()
![]()
![]()
Calls & Emails Made (per Rep) ![]()
![]()
![]()
Calls & Emails Made ![]()
![]()
![]()
Average Purchase Value ![]()
![]()
![]()
Average Profit Margin ![]()
![]()
![]()
Average Conversion Time ![]()
![]()
![]()
Average Time to Conversion ![]()
![]()
![]()
Average Follow-up Attempts ![]()
![]()
![]()
How to align Sales Teams with Sales Analytics?
A well-thought-out Sales Analytics strategy could be the most lethal weapon in your sales toolkit. It brings clarity and helps teams focus on doing what they do best. It helps increase your performance through optimized sales activities and increase in accountability.
Despite the obvious benefits it can be challenging for many sales teams to report on data required for Sales Analytics which may appear to not be a high-priority event. They tend to focus more on revenue-generating activities which directly impact sales performance figures and bring them closer to meeting their targets.
How do you align your sales analytics in a manner that allows your best sales reps to keep selling while accelerating their efforts and not obstructing them?
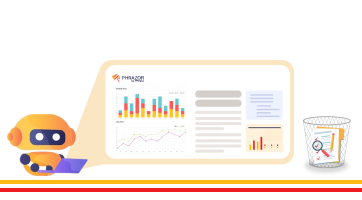
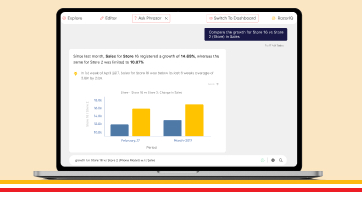
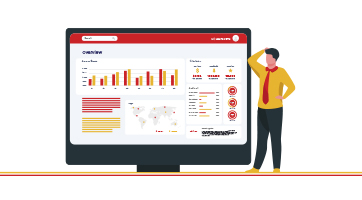
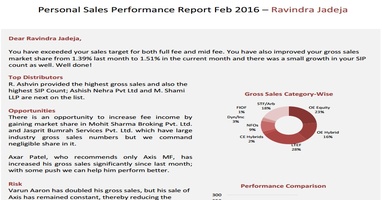
Sales Analytics Reports on Dashboards
Incorporating sales analytics within easy-to-use and intuitive dashboards is a solution. The dashboard should clearly communicate the insights from the analytics. This can be done using very traditional tools like Google Sheets, PowerPoint, or Excel. You could also opt for Business Intelligence tools (like Phrazor) which are a lot more efficient and can be used as an integrated plug-and-play feature or a standalone solution.
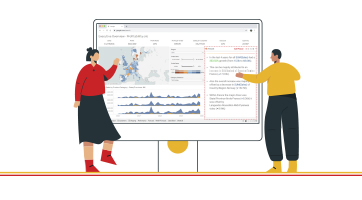
Sales Analytics on Leaderboards
Sales folks are a competitive lot and the idea of a leaderboard displaying their performance numbers can get the competition going. A leaderboard is generally shown on a TV set located close to the Sales teams in office. It is a great way to help teams track their performance and progress in real-time. It provides transparency, accountability, and fosters a data-driven culture, ensuring sales teams make informed business decisions.
If you are interested in exploring a customized solution relevant to your firm
About Phrazor
Phrazor empowers business users to effortlessly access their data and derive insights in language via no-code querying