2022-06-14 00:00:00
10 min read
When choosing technology, tools, and talent to put data to work, well-intentioned managers need to understand the nuances of solutions that help leverage data and compete on analytics to stay ahead in the game.
In today’s world, there is an explosion of data. Managers and organizations are exploring analytical solutions to achieve better performance using data. With terms like Business Intelligence (BI), Data Analytics, and Business Analytics being used interchangeably and the buzz around many others such as ‘Big Data’ and ‘Artificial Intelligence’ rapidly increasing, non-experts can be easily overwhelmed. Amid this confusion, it is important to note that real value creation occurs only when people are empowered by these tools and solutions.
As analytics comes of age and an increasing number of organizations invest in technology to aid expected ROIs, how can you determine which of these solutions is the best fit for your business?
Starting with brass tacks, what do each of these mean?
Let’s start with Business Intelligence (BI) because it is the umbrella solution of which Data Analytics and Business Analytics are subsets.
Business Intelligence (BI)
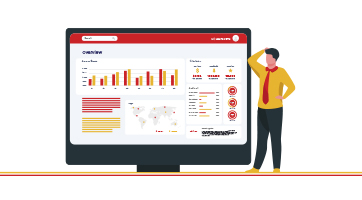
BI has evolved as an advanced form of business reporting and stems from a need for Performance Management, Monitoring & Review checks. Reports mainly reflect backward-looking analysis (lag indicators) of what has happened. With time, reports have evolved into real-time dashboards for the business user to monitor and review progress.
Today, Business Intelligence incorporates the collection, management, and reporting of data and also the analytical techniques and computing approaches performed on data.
Most BI tools help answer ‘what happened’ through visual dashboards. These tools are powerful in their capability to produce results that can be broken down and analyzed from various perspectives to find important insights around Performance Monitoring.
However, Gartner cites the decline of the dashboard as one of the Top 10 Trends in Data and Analytics for 2020. It highlights the decrease in time spent by users on predefined dashboards. There is a shift to more dynamic data stories highlighting the most relevant insights in context to the user’s business, role, and requirement.
Data Analytics
As trends point to a more analytical future for almost every industry and organization, the amount of data available will continue increasing. This ever-increasing stream of data has given rise to a new generation of technically literate executives (Data Scientists and Data Analysts) who depend on technology to process vast quantities of data.
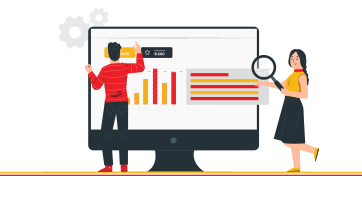
Data Analytics is purely driven by the demand for rigorous and passionate statistical and quantitative analysis. It uses complex analytical methods, data models and is mostly process- and method-driven. It need not always account for domain or business context to analyze patterns, trends, correlations, comparisons, or even causal analysis.
Data scientists/analysts aren’t necessarily business experts and may not always understand business interests or functions. And yet they are capable of delivering answers to ‘what’ and ‘why’ powered solely by Data Analytics.
Business Analytics
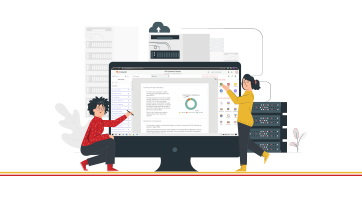
Business Analytics is the latest evolution in BI tools and also a trend that is fast catching up. It is mainly meant for business users and is designed to support decision-making and investigating ad-hoc queries.
According to Gartner, by 2023, more than 33% of large organizations will have analysts practicing decision intelligence, including decision modeling. Decision intelligence brings together several disciplines, including decision management and decision support.
Thus Business Analytics is mainly driven by business objectives and impact. It merely uses quantitative and/or statistical models and technology as a medium to align, execute, monitor, and tune decision models and business processes in the context of business outcomes.
Business users need not have technical skills or analyst expertise to reap the benefits of analytics and data. However, there are certain prerequisites:
- A moderate amount of quality data relevant to your industry to support analytics
- The right analytics application to support your business needs
- An analytical approach to making decisions driven by data
Let’s understand these nuances with a real-world application of BI Dashboard, Data Analytics, and Business Analytics
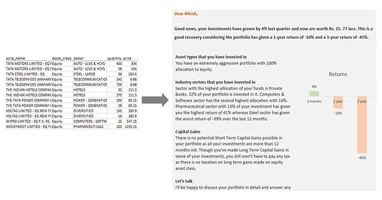
Consider an online FMCG company selling baby care products through e-commerce platforms.
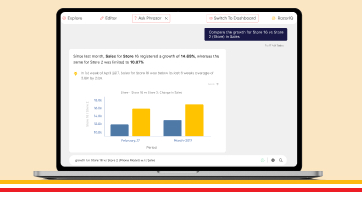
- If the company opts for a BI dashboard, the brand manager will receive real-time updates and can monitor sales by value and volume as per - Product, Categories, Region, and Customer Segments. Budgeted v/s actual performance can also be tracked.
- Considering the company is selling online, it has access to a lot of web data which can be measured using Google Analytics. For instance number of visits, % of new unique visits, website traffic channels, bounce rate, page impressions, and clicks. Now if a data analyst or scientist analyzes this data using statistical modeling without even understanding the baby care product business or domain expertise, s/he can help segment customers purely based on their website browsing and online purchase behavior. The focus is to uncover patterns and trends, identify outliers, and build buyer personas accordingly.
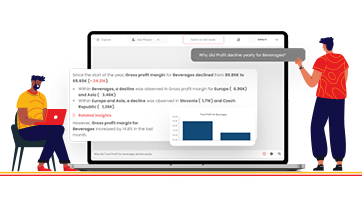
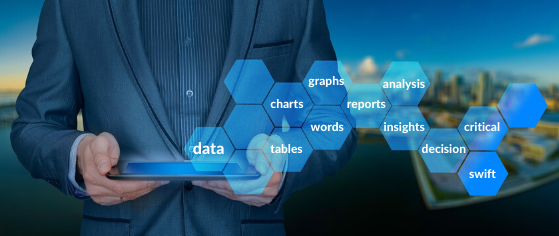
- To further support decision making, Business Analytics will help answer questions such as ‘how to price certain product categories’, or ‘what should be the marketing spend and ideal channel to target a specific customer segment’. These are everyday critical problems that a business user is required to solve and using analytics to explore such decisions will provide a competitive edge and a fact-based optimal approach as opposed to only an intuition-based one.
The goal of understanding these nuanced differences is to give Business Managers a takeoff point to evaluate where they are in their Analytical and Digital Transformation journeys and accordingly pursue strategy and implementation of Data and Analytics.
Are you ready to embrace Analytics, embark on a committed journey to explore the possibilities and reap the many benefits it has to offer?
What if you had the advantage of accessing all three tools under one roof?
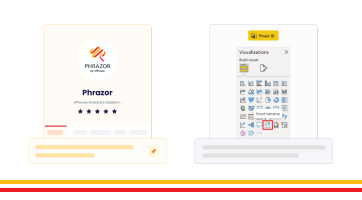
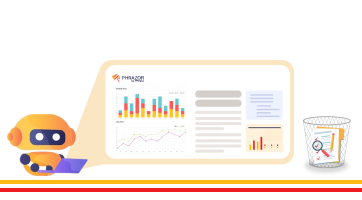
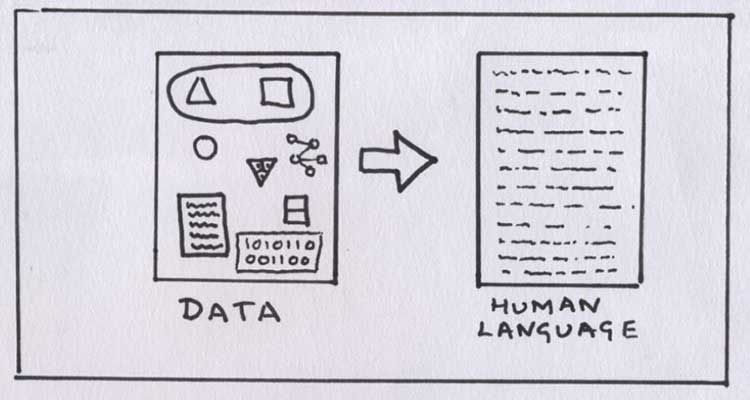
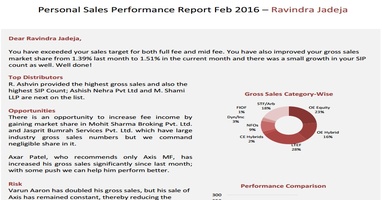
Phrazor is one such AI-powered Analytics platform that uses Natural Language Generation (NLG) to provide all three solutions - BI dashboard, Data Analytics, and Business Analytics on a single platform. It analyzes, reasons, and writes data stories to support decision-making just like a human expert.
On the BI side, it helps create automated reports tailored to the business user with domain and function context in a matter of seconds. For technical users and data analysts, it is powered by a robust statistical engine that has diagnostic, predictive, and prescriptive capabilities.
If you are looking to answer critical business questions on the go, it serves as a self-service plug-and-play Business Analytics tool where you can use customized templates and a Natural Language Query (NLQ) wizard to help answer business-related questions or receive recommendations to make decisions using your data.
If you want to explore a customized solution relevant to your firm, our Solutions Specialists can help you out.
About Phrazor
Phrazor empowers business users to effortlessly access their data and derive insights in language via no-code querying